
The S&P500 has moved slightly lower. Our main hourly wave count did allow for this possibility, but we were expecting a small amount of upwards movement for Wednesday’s session.
We still have the two daily wave counts, with the main wave count having a slightly higher probability than the alternate.
For our main wave count today I have two hourly wave counts, looking at most recent movement in a slightly different way.
Click on the charts below to enlarge.
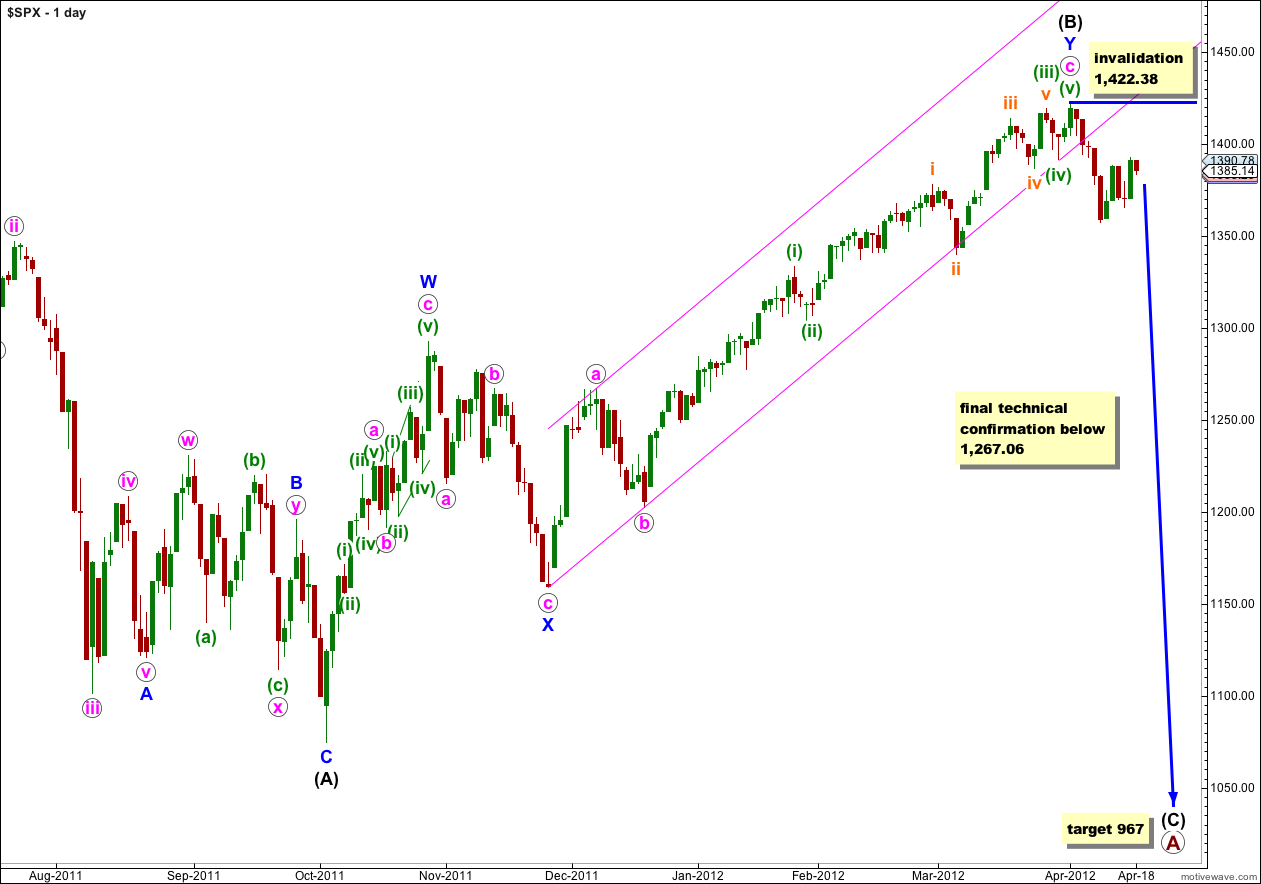
This main wave count remains slightly more likely than our alternate. This is because the subdivisions within W blue of (B) black have a much better fit. Within wave c pink of wave Y blue the subdivisions also fit perfectly and there are good Fibonacci ratios within it.
At primary degree wave A would be an expanded flat correction because wave (B) black is a 123% correction of wave (A) black. We would expect wave (C) black to most likely reach 1.618 the length of wave (A) black a 967. If price moves through this first target then the next (less likely) target would be where wave (C) black reaches 2.618 the length of wave (A) black at 685.
Hourly Main Wave Count
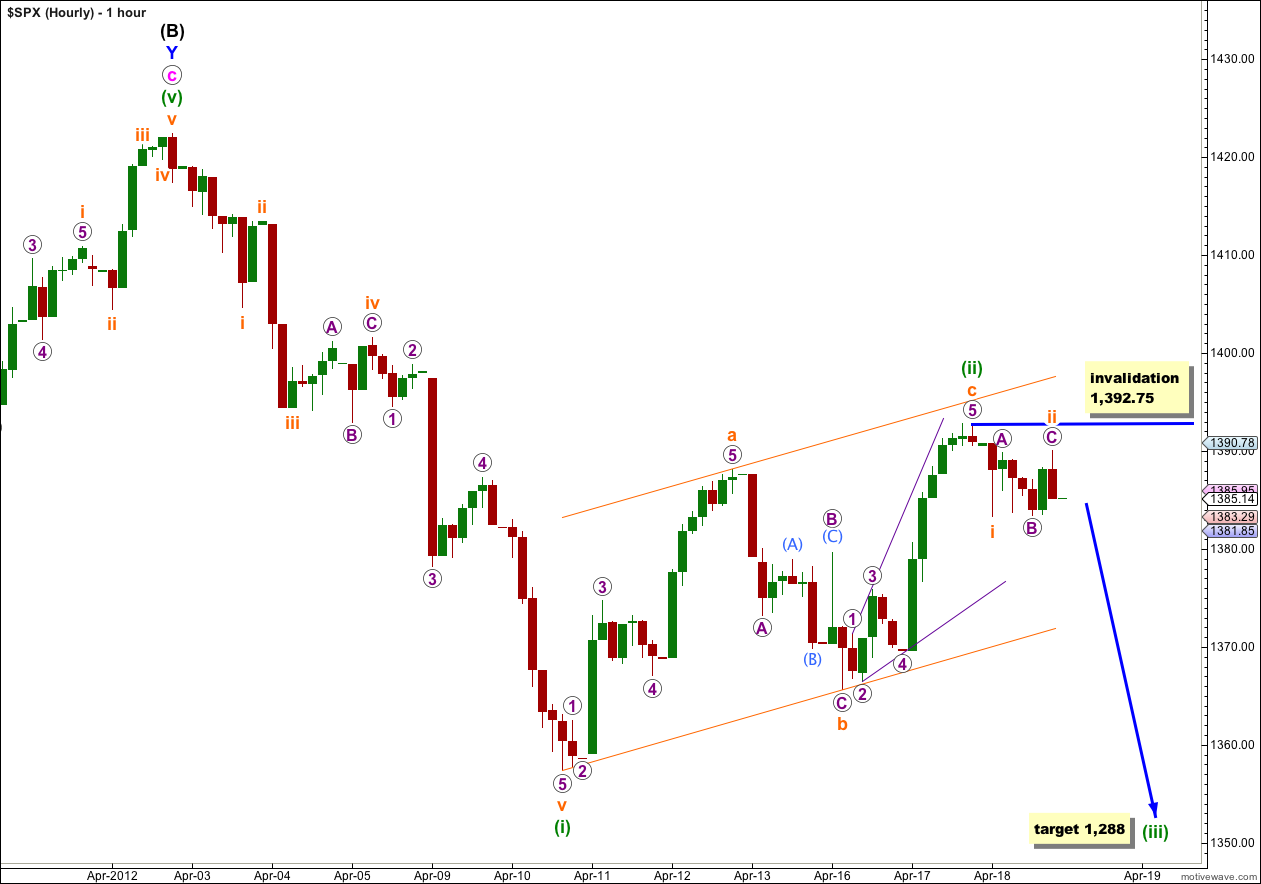
Recent upwards movement may be seen as a completed zigzag for wave (ii) green, if wave c orange was an ending expanding diagonal with an exceptionally long fifth wave (but this structure conforms to all rules for diagonals).
Thereafter, the sideways and lower movement for Wednesday’s session may have been another low degree second wave correction.
At 1,288 wave (iii) green would reach 1.618 the length of wave (i) green.
We should use Elliott’s channeling technique about wave (ii) green. When this channel is breached by downwards movement then we shall have indication that (ii) green is over and (iii) green should be underway. Until this channel is breached we must accept the risk that wave (ii) green could continue yet further sideways and a little higher as a double zigzag or double combination.
Within wave (iii) green wave ii orange may not move beyond the start of wave i orange. Movement above 1,392.75 would invalidate this wave count. At that stage we should use the alternate hourly wave count below.
Hourly Alternate Wave Count.
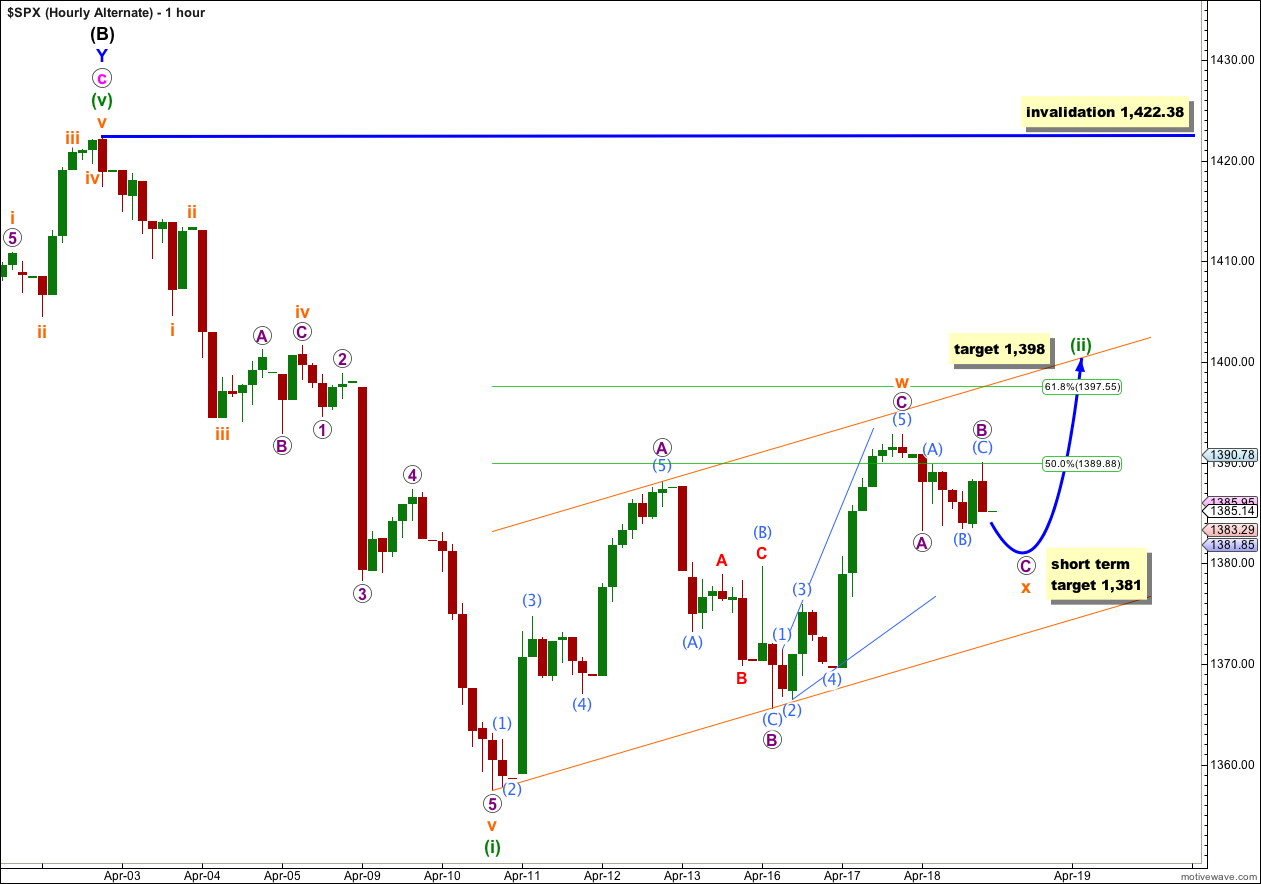
If we simply move the degree of labeling within wave (ii) green down one degree, we may be seeing a double zigzag or double combination unfold.
Wave x orange would be a zigzag structure to join the two structures in the double, waves w and y orange.
Within wave x orange wave C purple is unlikely to be complete. It may reach equality with wave A purple at 1,381.
X waves are like B waves. It would probably find support about the lower edge of the parallel channel containing wave w orange, if it got down that far.
The target at 1,398 for wave (ii) green to end expects it to reach the 0.618 Fibonacci ratio of wave (i) green.
Wave (ii) green may not move beyond the start of wave (i) green. This wave count is invalidated with movement above 1,422.38.
This wave count has a lower probability than the main hourly wave count because it would see wave (ii) green starting to be disproportionately large in relation to wave (i) green, and because on the daily chart the structure looks typically complete.
Alternate Daily Wave Count.
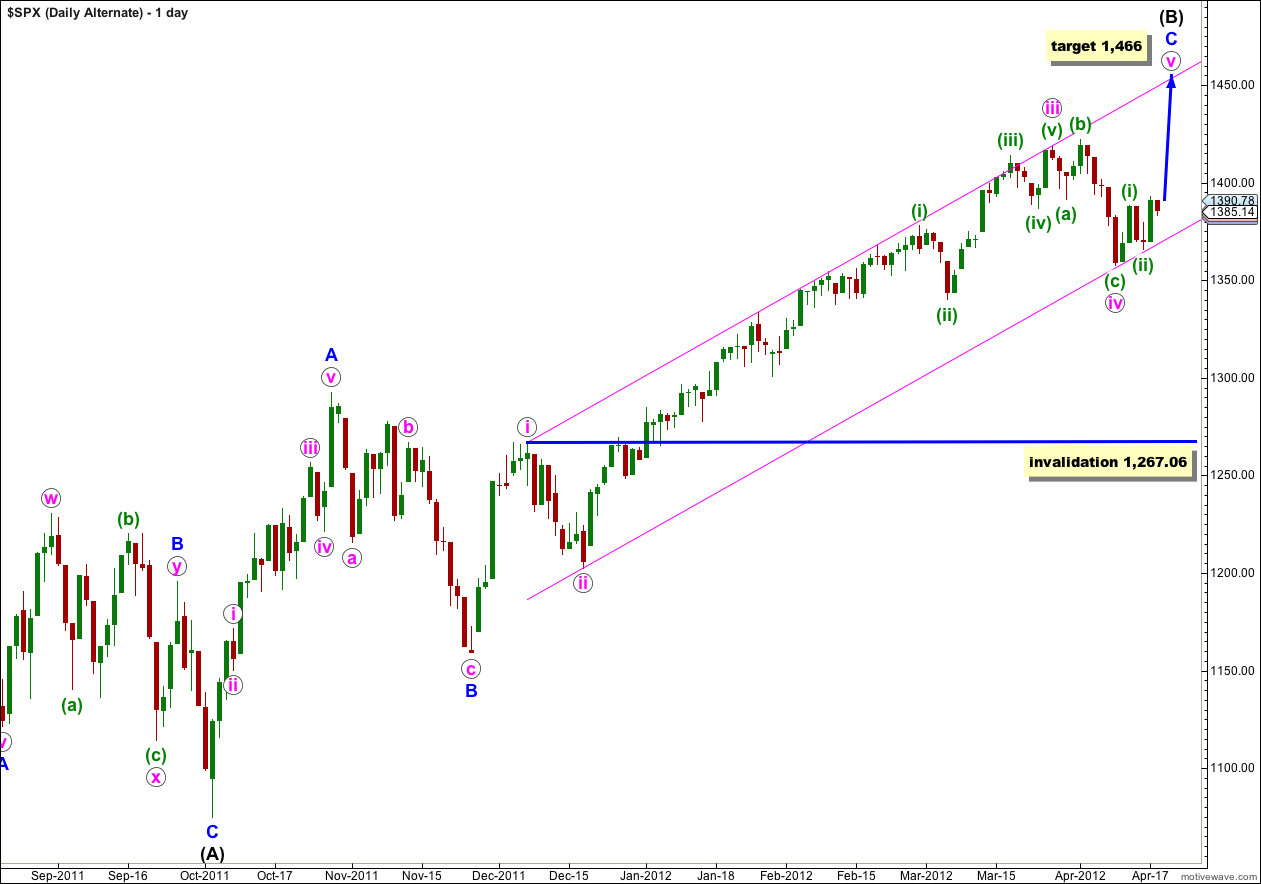
With price firmly within the parallel channel about wave C blue this wave count looks correct as far as the trend channel goes, but its subdivisions don’t fit as well as the main wave count and it still has a slightly lower probability.
If the upwards wave labeled A blue here subdivides into a five then wave (B) black may be a single zigzag structure. This wave count has a fairly low probability because this wave subdivides most easily into a three, and it is difficult (but possible) to see it as a five. As a five it has a strange looking third wave which reduces the probability of this wave count.
At 1,466 wave v pink would reach equality with wave i pink. Wave (B) black would be almost 138% the length of wave (A) black, the maximum common length for a B wave in relation to an A wave of a flat correction.
Wave iv pink may not move into wave i pink price territory. This wave count is invalidated with movement below 1,267.06. However, in practice I would discard this wave count before price gets that low, as a strong and significant breach of the parallel channel containing wave C blue would reduce the probability of this wave count.