
Yesterday’s analysis expected the most likely direction for Thursday’s session would have been downwards, but price has moved higher. We had an alternate wave count to cover this possibility.
The alternate hourly wave count was confirmed and the main hourly wave count was invalidated within 15 minutes of the market opening. Thereafter, our target for upwards movement on the alternate wave count was 1,385 – 1,387. This target has been exceeded by just over 2 points.
Click on the charts below to enlarge.
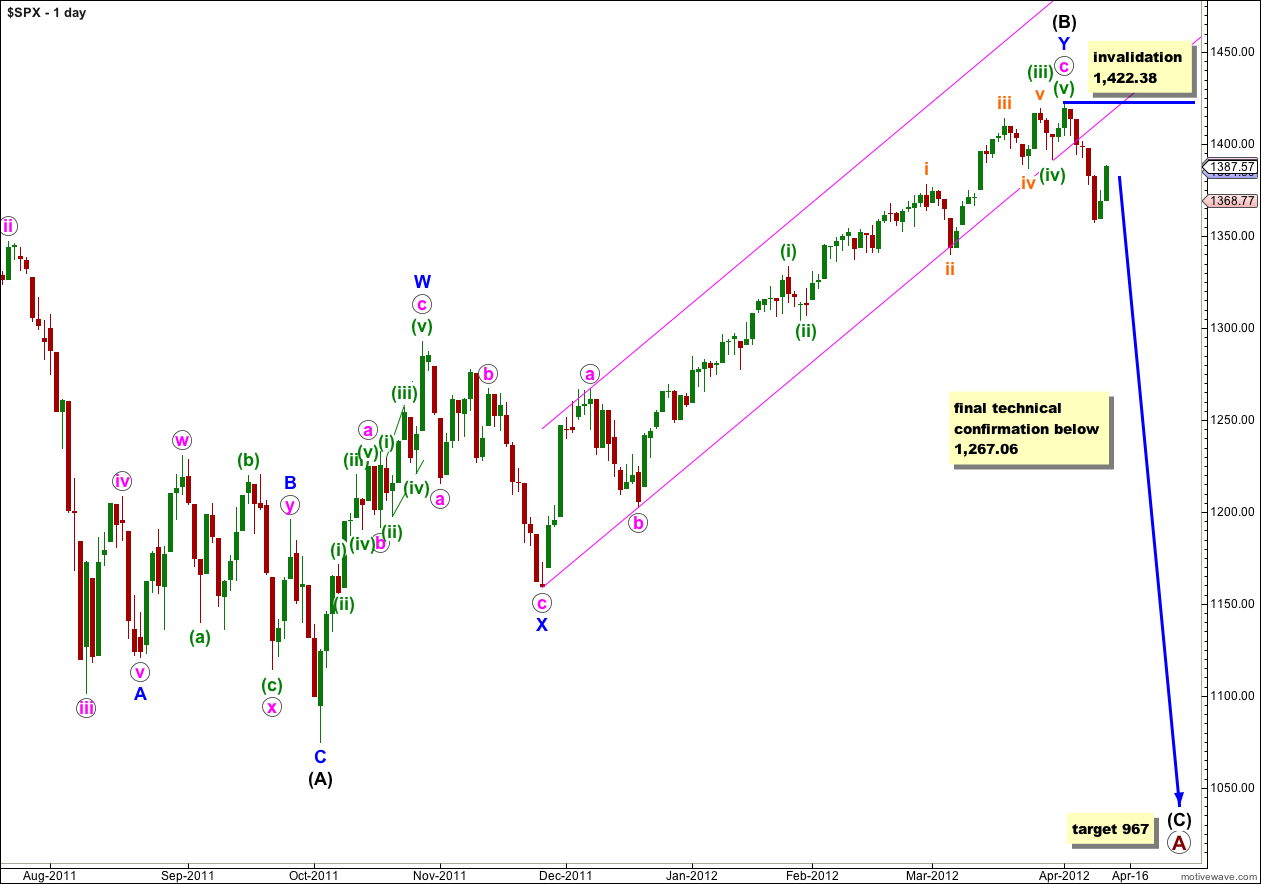
At primary degree wave A would be an expanded flat correction because wave (B) black is a 123% correction of wave (A) black. We would expect wave (C) black to most likely reach 1.618 the length of wave (A) black a 967. If price moves through this first target then the next (less likely) target would be where wave (C) black reaches 2.618 the length of wave (A) black at 685.
Within wave (C) black no second wave correction may move beyond the start of its first wave. This wave count is clearly invalidated with any movement above 1,422.38.
This wave count has a typical look for wave c pink. The third wave is extended which is most common, and its subdivisions can be seen clearly on the daily chart which should be expected. It agrees with MACD in that within wave c pink the strongest reading is for the third wave.
Wave (B) black is a double zigzag structure which is a common structure. Within the first zigzag labeled W blue the subdivisions fit most neatly as a zigzag.
If the channel on the daily chart for the alternate wave count below is breached then we may have significantly increased confidence in this wave count. Movement below 1,267.06 would finally and technically confirm a large trend change.
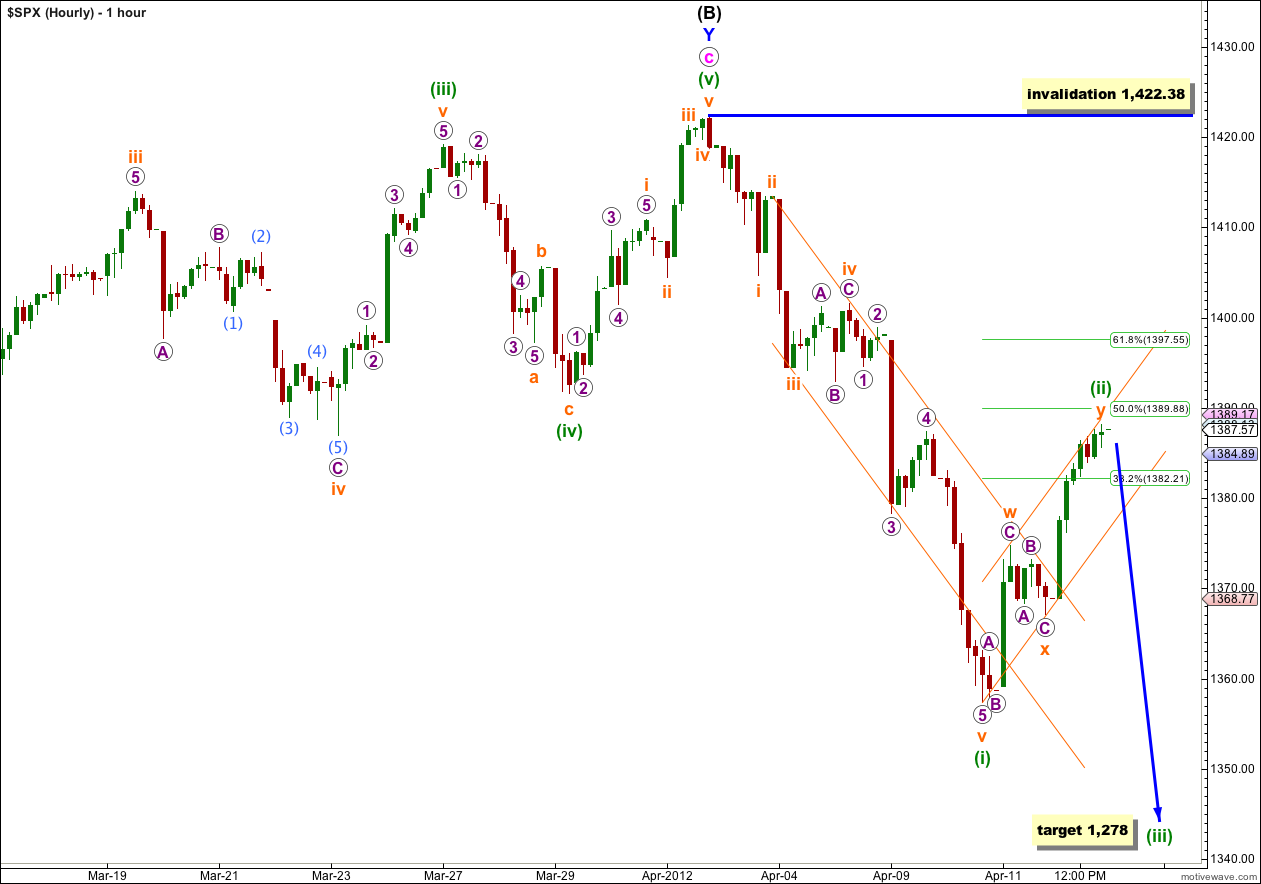
I have changed the hourly wave count to see downwards movement as a complete five wave impulse, with a fifth wave extension rather than a third.
This wave count has a much neater fit than yesterday’s wave count. It explains upwards movement nicely and all waves are in proportion.
Ratios within wave (i) green are: wave iii orange is 1.28 points longer than equality with wave i orange, and wave v orange 2.28 points short of 2.618 the length of wave i orange.
Ratios within wave v orange extension are: wave 3 purple has no Fibonacci ratio to wave 1 purple, and wave 5 purple is just 0.14 longer than 4.236 the length of wave 1 purple.
Within wave (i) green there is perfect alternation between waves ii and iv orange. Wave ii orange is a zigzag and 49% of wave i orange, and wave iv orange is an expanded flat and 38% of wave iii orange.
This impulse fits perfectly within its trend channel, with a fifth wave overshoot.
Wave (ii) green subdivides best as a double zigzag structure. Within the second zigzag all subdivisions could be complete on the 5 minute chart, or the final C wave within this zigzag could extend higher.
We may draw a parallel channel about wave (ii) green. When this channel is breached by downwards movement then we shall have a strong indication that wave (iii) green has begun. If wave (ii) green continues to move higher price should probably continue to find resistance about the upper edge of this channel.
It looks most likely that wave (ii) green is over here and wave (iii) green should start tomorrow.
I am much happier with this hourly wave count. Yesterday’s wave count would now look very strange with the out of proportion corrections.
At 1,278 wave (iii) green would reach 1.618 the length of wave (i) green. If wave (ii) green moves any higher this target would need to be recalculated.
Use the parallel channel drawn here about wave (ii) green to indicate when it is over. When we can see a full hourly candlestick below this small channel then we may take that as confirmation that a third wave down is underway. Draw the channel from the low labeled (i) green to the low labeled x orange, then place a parallel copy upon the high of w orange.
Wave (ii) green may not move beyond the start of wave (i) green. This wave count is invalidated with movement above 1,422.38.
Alternate Daily Wave Count.
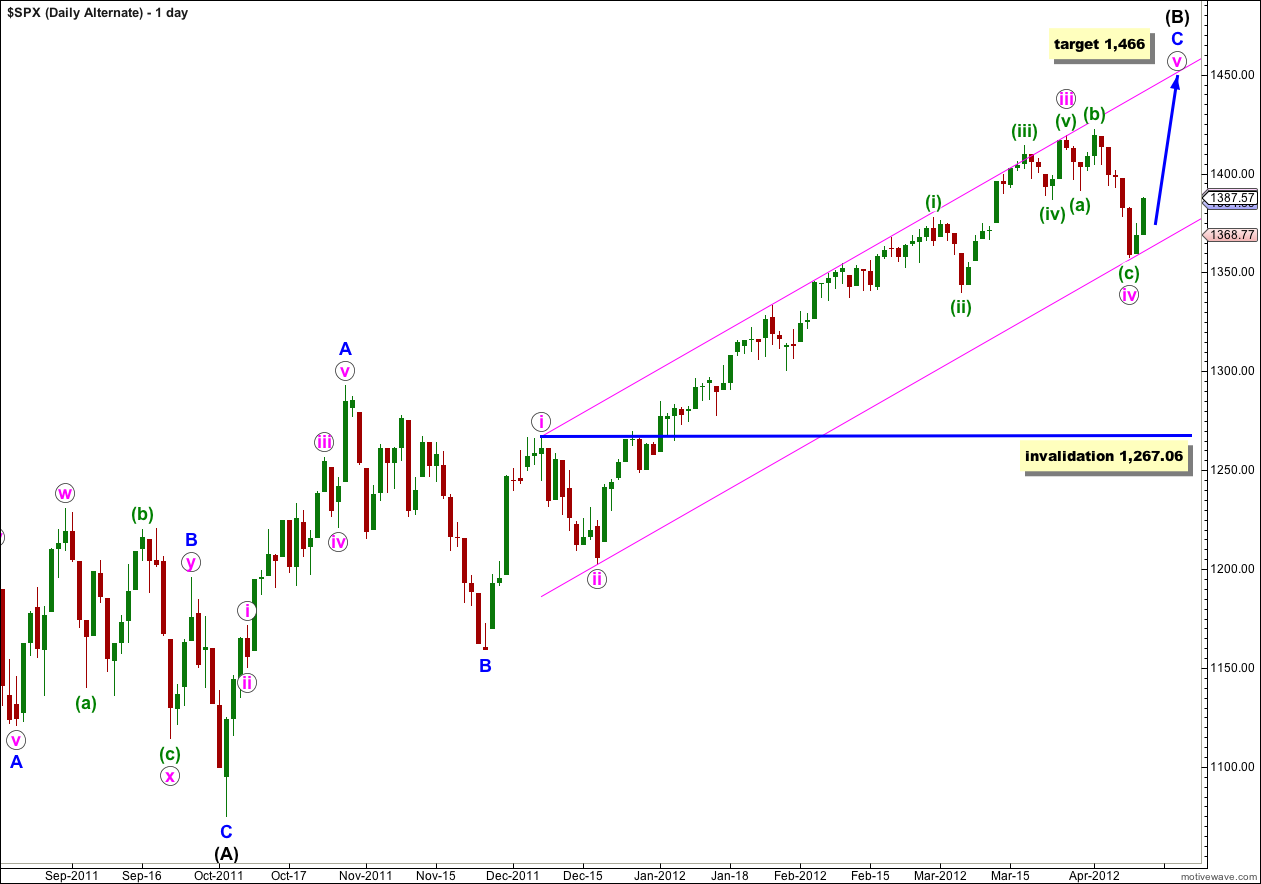
If the upwards wave labeled A blue here subdivides into a five then wave (B) black may be a single zigzag structure. This wave count has a fairly low probability because this wave subdivides most easily into a three, and it is difficult (but possible) to see it as a five. As a five it has a strange looking third wave which reduces the probability of this wave count.
However, we should consider the implications of the parallel channel about wave C blue. This channel has been nicely held to on the upper edge all along this long sustained rise, and until this channel is breached by downwards movement I want us to consider the possibility that we may yet see a final fifth wave up to new highs.
Within wave iv pink wave (c) green is now almost perfectly 1.618 the length of wave (a) green. Wave (b) green was a 112% correction of wave (a) green, and this is a very typical expanded flat correction, so far.
At 1,466 wave v pink would reach equality with wave i pink. Wave (B) black would be almost 138% the length of wave (A) black, the maximum common length for a B wave in relation to an A wave of a flat correction.
Wave iv pink may not move into wave i pink price territory. This wave count is invalidated with movement below 1,267.06. However, in practice I would discard this wave count before price gets that low, as a strong and significant breach of the parallel channel containing wave C blue would reduce the probability of this wave count.