
We now have a more convincing trend channel breach of the channel on the daily chart for our main wave count. This indicates a possible trend change.
However, we still have an alternate. If its trend channel is breached this week then we may be very confident of a trend change. If not, then we will have to make a judgement as to which of our daily wave counts has the highest probability, and understand the risk with a viable alternate wave count predicting the opposite movement.
If we have had a trend change then it should only be a few more days before the channel on the daily chart for our alternate is breached clearly.
Click on the charts below to enlarge.
Main Wave Count.
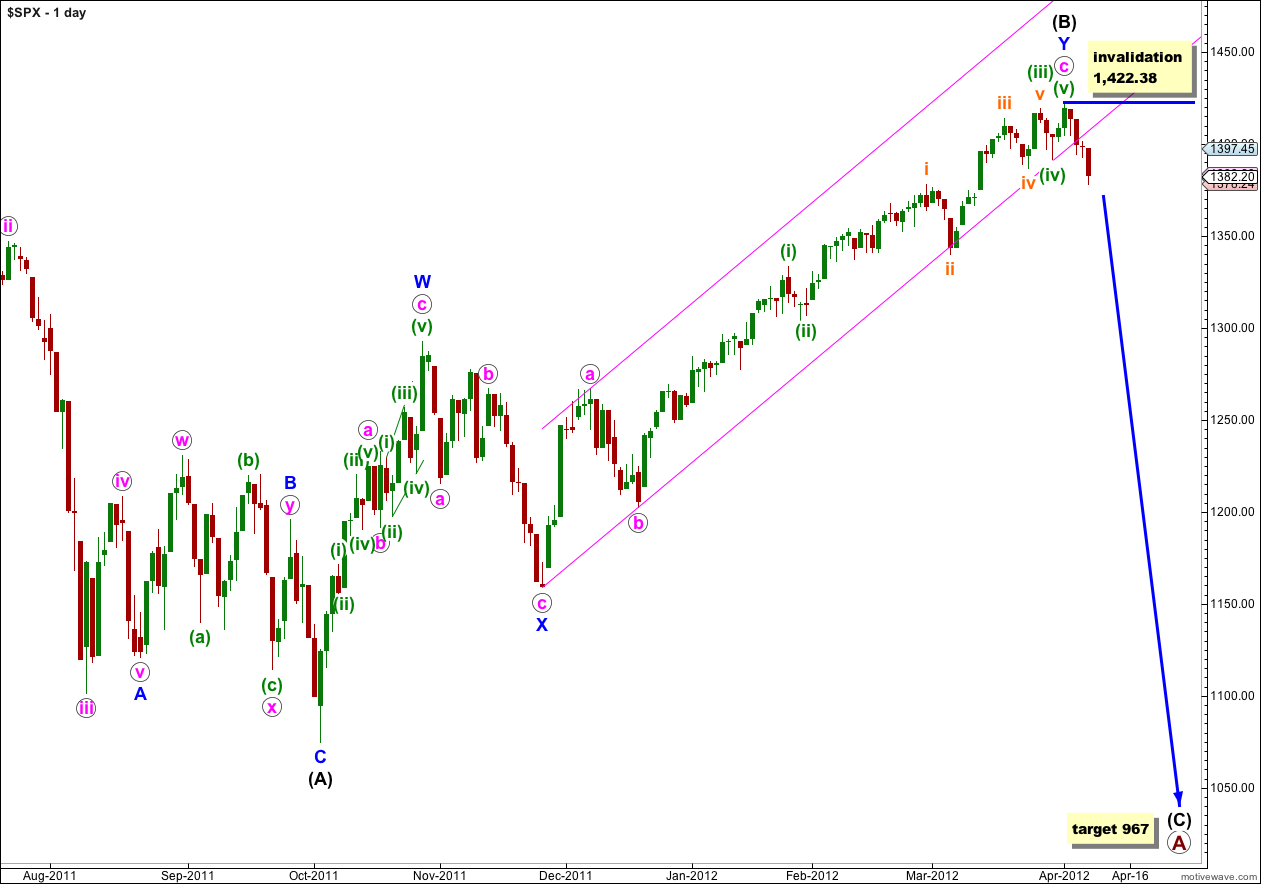
With such a clear channel breach after Monday’s session I am now switching this over to the main wave count. At this stage it has the highest probability because it has the best look and the subdivisions are the best fit.
At primary degree wave A would be an expanded flat correction because wave (B) black is a 123% correction of wave (A) black. We would expect wave (C) black to most likely reach 1.618 the length of wave (A) black a 967.
Within wave (C) black no second wave correction may move beyond the start of its first wave. This wave count is clearly invalidated with any movement above 1,422.38.
This wave count has a typical look for wave c pink. The third wave is extended which is most common, and its subdivisions can be seen clearly on the daily chart which should be expected. It agrees with MACD in that within wave c pink the strongest reading is for the third wave.
Wave (B) black is a double zigzag structure which is a common structure. Within the first zigzag labeled W blue the subdivisions fit most neatly as a zigzag.
If the channel on the daily chart for the alternate wave count below is breached then we may have significantly increased confidence in this wave count. Movement below 1,267.06 would eventually finally technically confirm a large trend change.
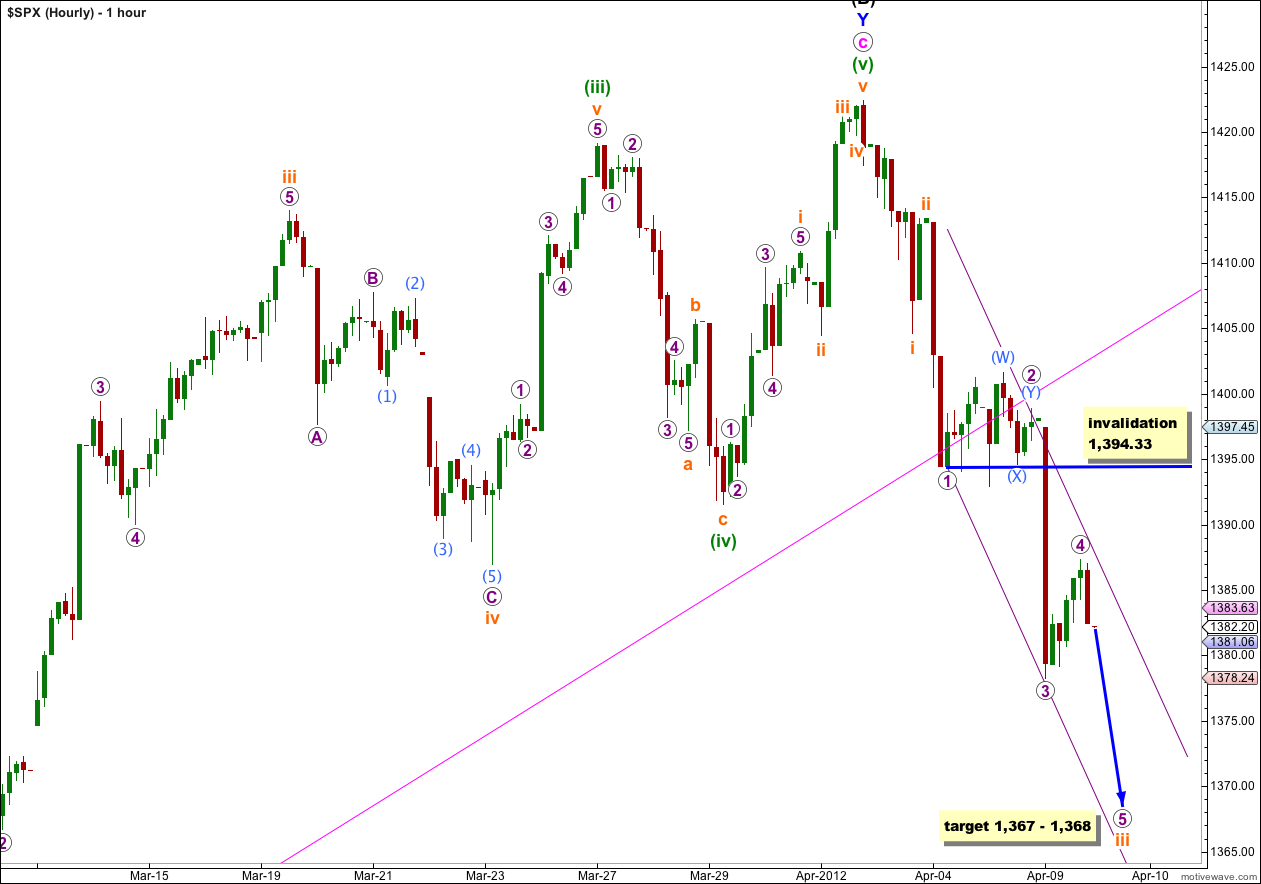
On the hourly chart we now have a nice clear five down. This adds some confidence to the idea that we may have had a big trend change.
This main hourly wave count has a slightly higher probability than the alternate below.
It is common for one of the actionary waves within an impulse to extend, and the most commonly extended wave is the third. This may be what is unfolding.
At 1,367 wave iii orange would reach 2.618 the length of wave i orange. At 1,368 wave 5 purple within wave iii orange would reach equality with wave 1 purple. This gives us a high probability one point target zone for further downwards movement.
We may use Elliott’s first channeling technique to draw a parallel channel about wave iii orange. Draw the first trend line from the lows of 1 to 3 purple, then place a parallel copy upon the high of wave 2 purple. This nearly showed where wave 4 purple may have ended. Wave 5 purple to complete wave iii orange may end either mid way within this channel or about the lower edge.
When markets open tomorrow any further extension of wave 4 purple may not move into wave 1 purple price territory. This wave count would be invalidated if price moves above 1,394.33.
When wave iii orange completes then the invalidation point must move up to the low of wave i orange at 1,404.62. Wave iv orange may not move into wave i orange price territory.
Alternate Hourly Wave Count.
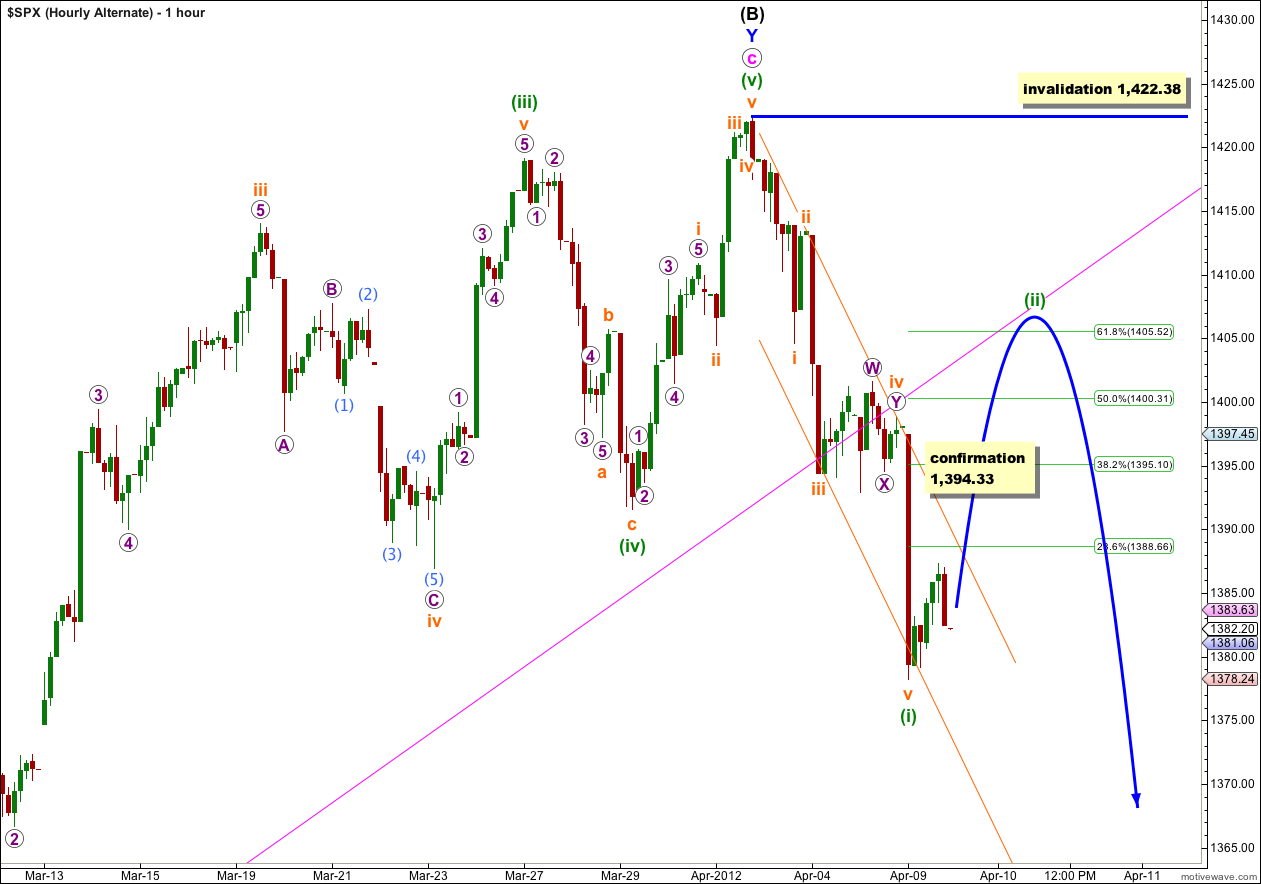
A second wave correction could unfold tomorrow, which could end around 0.618 of wave i green, at about 1,405. It may find some resistance about the lower edge of the pink parallel channel which was drawn on the daily chart and copied over to this chart.
Ratios within wave (i) green are: wave iii orange is just 1.29 points longer than equality with wave i orange, and wave v orange is 1.59 points longer than equality with wave iii orange. There is nice alternation between wave ii orange as a zigzag and wave iv orange as a double combination.
If price moves above 1,394.33 then a second wave correction may be considered confirmed because at that stage the main hourly wave count would be invalidated. If this occurs expect a deeper and longer lasting correction.
We may use Elliott’s second channeling technique to draw a parallel channel about downwards movement. Draw the first trend line from the highs of ii to iv orange, then place a parallel copy upon the low of iii orange. When this channel is breached by upwards movement then we would also have an indication that this wave count is correct, that wave (i) green is complete and wave (ii) green is underway.
Wave (ii) green may correct right up to the start of wave (i) green but not beyond. This wave count is invalidated with movement above 1,422.38.
Alternate Daily Wave Count.
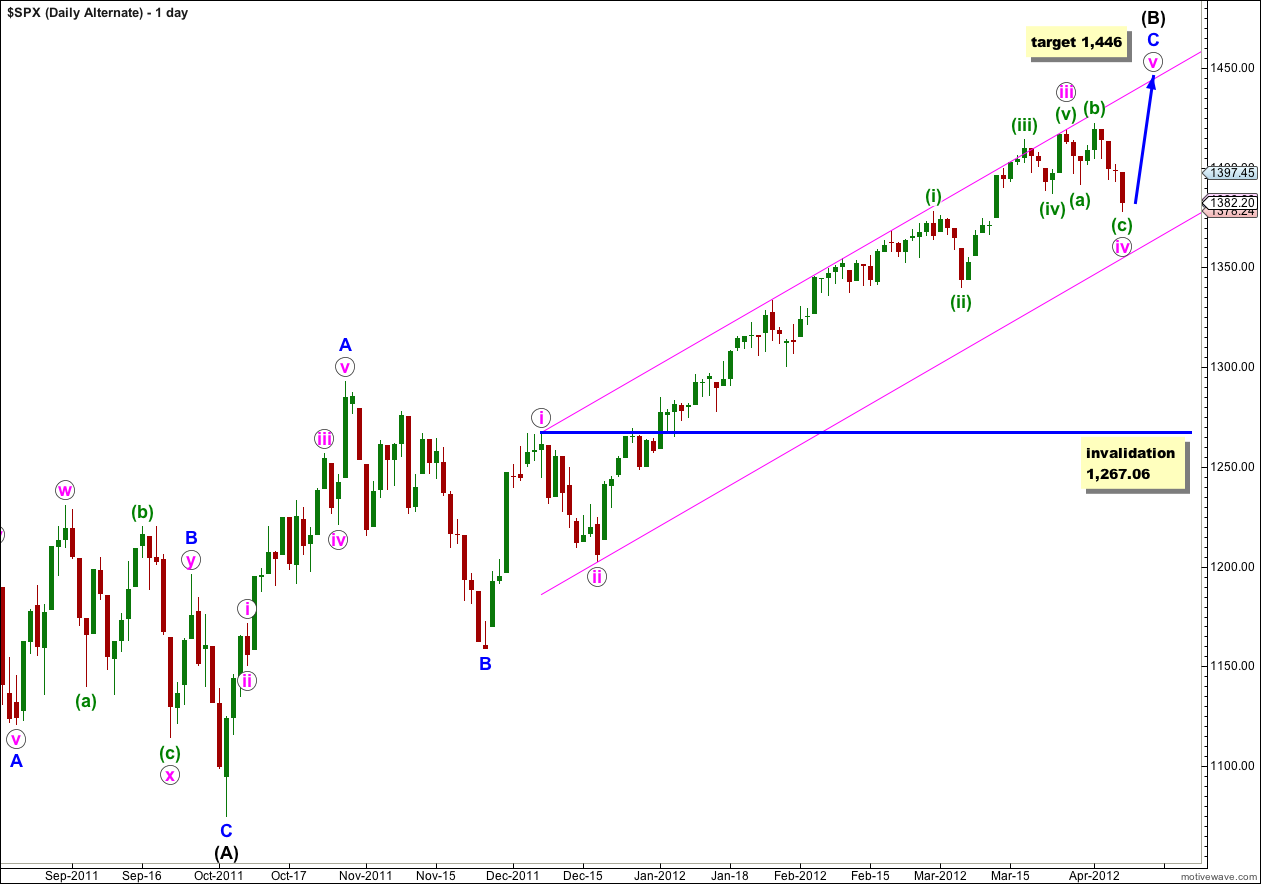
If the upwards wave labeled A blue here subdivides into a five then wave (B) black may be a single zigzag structure. This wave count has a fairly low probability because this wave subdivides most easily into a three, and it is difficult (but possible) to see it as a five. As a five it has a strange looking third wave which reduces the probability of this wave count.
However, we should consider the implications of the parallel channel about wave C blue. This channel has been so nicely held to on the upper edge all along this long sustained rise, and until this channel is breached by downwards movement I want us to consider the possibility that we may yet see a final fifth wave up to new highs.
Within wave iv pink wave (c) green is now almost perfectly 1.618 the length of wave (a) green. Wave (b) green was a 112% correction of wave (a) green, and this is a very typical expanded flat correction, so far.
At 1,446 wave v pink would reach 0.618 the length of wave i pink.
If price continues lower tomorrow then the probability of this wave count will reduce. Look out for support about the lower edge of this pink parallel channel.
Wave iv pink may not move into wave i pink price territory. This wave count is invalidated with movement below 1,267.06. However, in practice I would discard this wave count before price gets that low, as a strong and significant breach of the parallel channel containing wave C blue would reduce the probability of this wave count.