
New York is closed April 6th for Good Friday. This analysis will be the last for this trading week.
The S&P 500 moved mostly sideways in a very small range to end the trading week. Although we now have a trend channel breach on the daily chart, it is very unconvincing to call a trend change.
I have two alternates for consideration to end the trading week. One is the resurrection of an old idea and, importantly, it has a different trend channel. We may use invalidation / confirmation points to work with these alternates next week.
It has been my experience over the years that about the time of major trend changes there are often multiple alternate possibilities, and the situation can be remarkably unclear. I have a suspicion that this is what is happening at this time.
To remain outside of the market at these times is a valid position to take. When the dust settles, hopefully next week, we may have clarity and a wave count may emerge with a high probability and the right look. Until it does, I will continue to consider all possibilities for you.
Click on the charts below to enlarge.
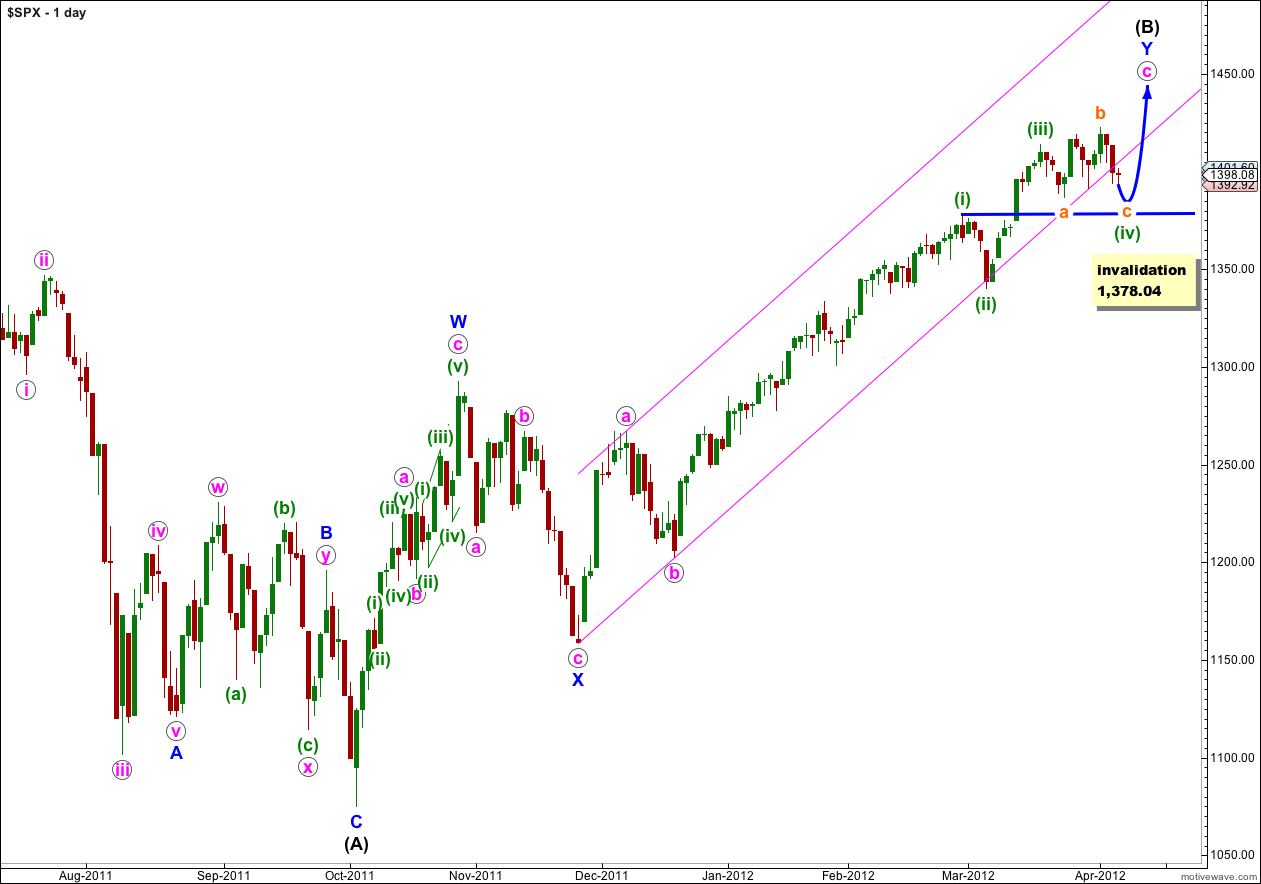
Although technically we have a trend channel breach from Thursday’s session, it is unconvincing as to raise doubt. If we had seen a trend change I would expect stronger downwards movement. However, if this is a fourth wave correction for (iv) green I would have expected price to remain within this channel.
This indicates that perhaps I may have the wrong channel. For that reason I have developed another alternate (which is based upon an idea I was using up until a few weeks ago) and I present this at the end of analysis for you to consider.
If wave (ii) green was a shallow zigzag then given the guideline of alternation we may expect wave (iv) green to be a deeper flat, triangle or double. This wave count sees wave (iv) green as a flat correction, which although would be shallow is still deeper than wave (ii) green was to wave (i) green. This satisfies the guideline of alternation nicely.
Within wave (iv) green wave b orange is an obvious zigzag. Wave c orange is highly likely to move price below the end of wave a orange to avoid a rare running flat, but it does not have to. All it has to do is subdivide into a five.
When wave (iv) green is complete then we may calculate a maximum limit upwards for wave (v) green. Wave (v) green may not be longer than equality with wave (iii) green at 73.97 points, because wave (iii) green may not be the shortest wave.
Wave (B) black is correcting the three wave structure of wave (A) black within a flat correction at primary degree. The maximum common length for wave (B) black in relation to wave (A) black is 138%. This would be achieved at 1,464 and it is likely we shall see a trend change before this price point is reached.
Wave (iv) green may not move into wave (i) green price territory. This wave count is invalidated with movement below 1,378.04.
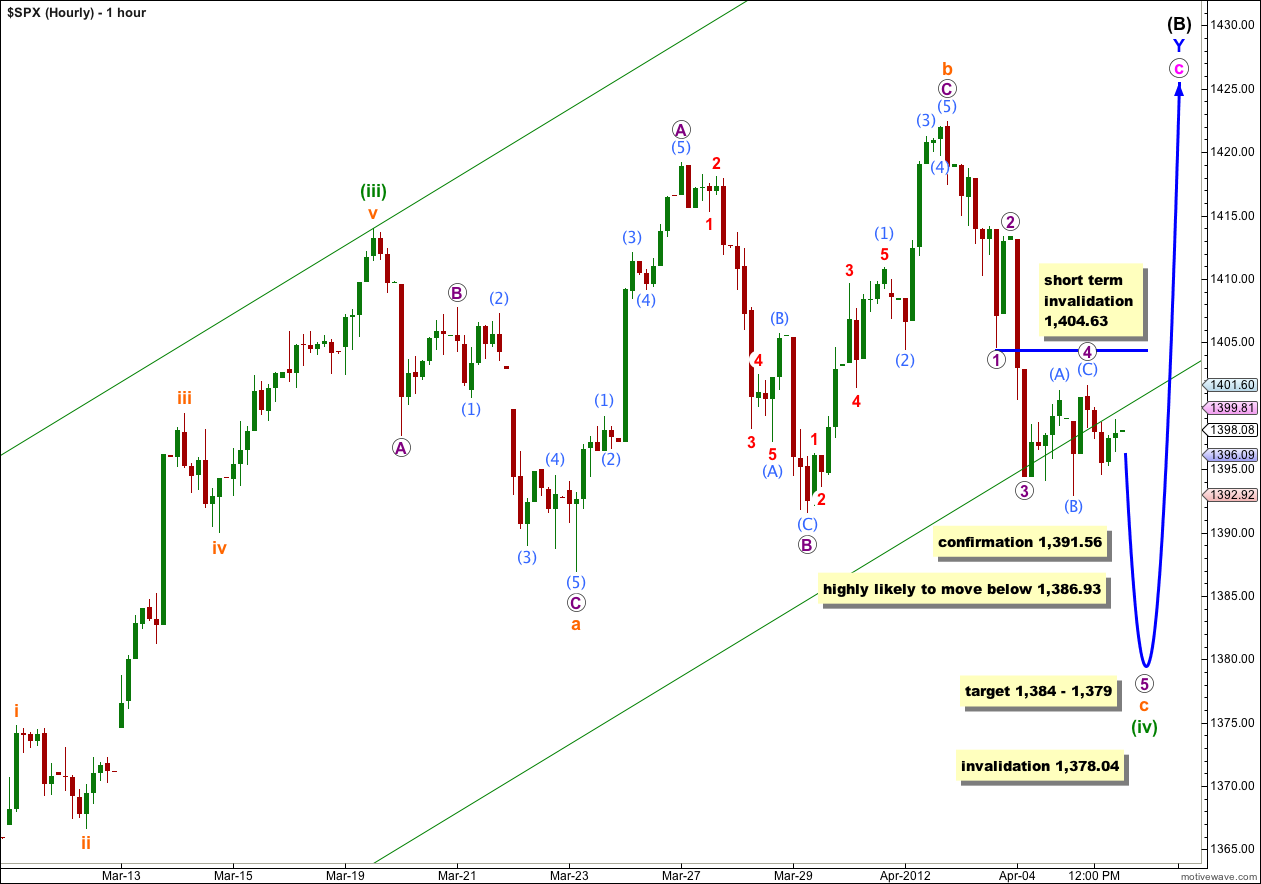
I am only going to use this one hourly wave count today. The other idea, an ending contracting diagonal, remains somewhat valid but looks so odd now as to be extremely unlikely.
This wave count fits exactly with the main daily wave count.
Wave b orange was a 131% correction of wave a orange which indicates this flat is an expanded flat. An expanded flat usually has a C wave which ends substantially beyond the end of the A wave. At 1,379 wave c orange would reach 1.618 the length of wave a orange.
Within wave c orange wave 3 purple is just 1.29 points longer than equality with wave 1 purple. At 1,384 wave 5 purple would reach equality with wave 1 purple.
Thus we have a 5 point target zone for one more downwards spike before price turns back up again. If this occurred quickly during Monday’s session, and price reentered the parallel channel on the daily chart, then the breach would be completely unconvincing and the possibility that we shall yet see new highs would be real.
However, at this stage the situation remains very unclear.
With Monday being Easter Monday I expect markets will be muted and this may not happen.
Movement above 1,404.63 would indicate that wave 5 purple may be over (it could be truncated) and that wave (iv) could be over.
Movement below 1,378.04 would invalidate this wave count.
First Alternate.
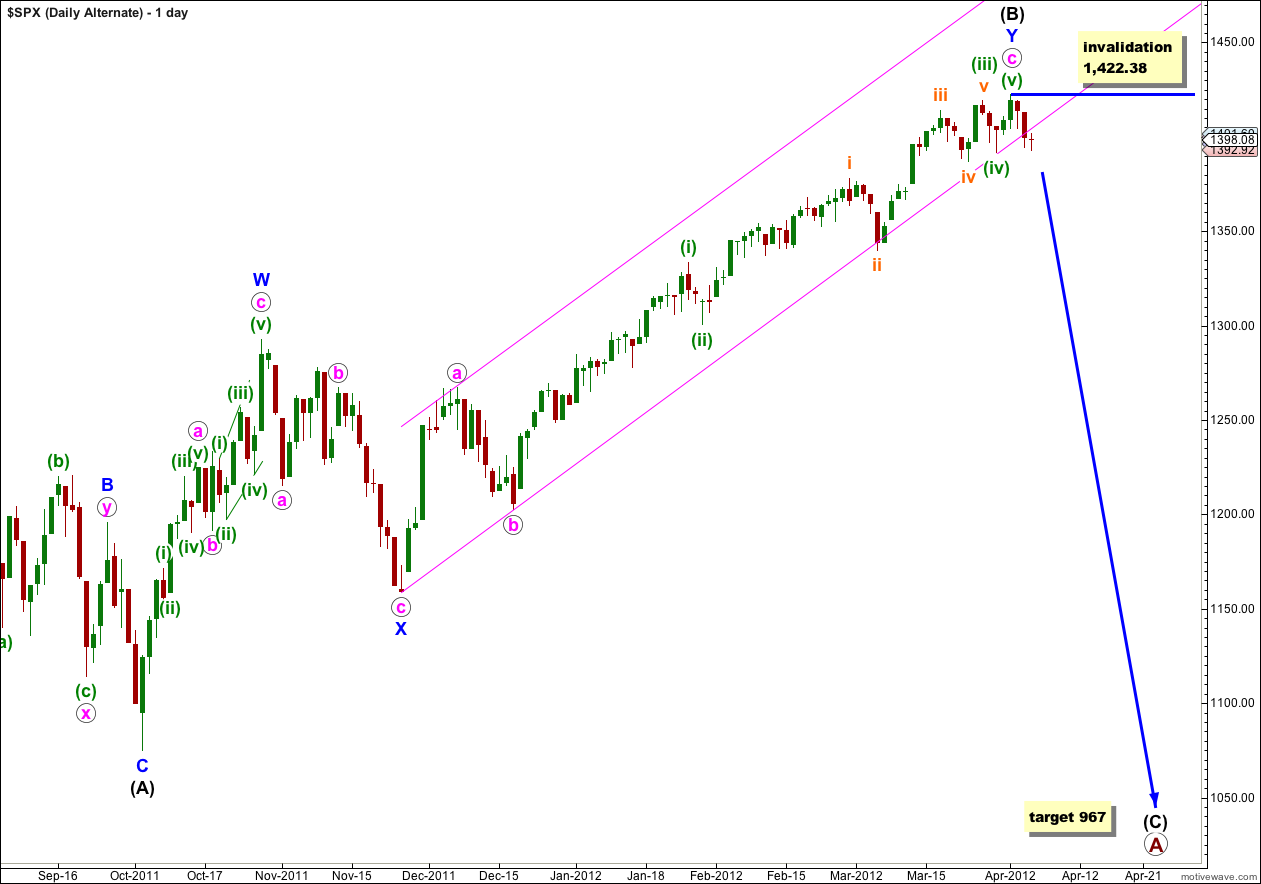
With a technical, but unconvincing, trend channel breach on the daily chart we must consider the possibility that we have last week seen a major trend change for the S&P 500.
Within the zigzag of wave Y blue wave c pink has no Fibonacci ratio to wave a pink.
Ratios within wave c pink are: wave (iii) green has no Fibonacci ratio to wave (i) green, and wave (v) green is just 0.12 short of 0.236 the length of wave (i) green.
Ratios within wave (iii) green are: wave iii orange is 3.58 points shorter than wave i orange, and wave v orange is 2.6 points longer than 0.382 the length of wave i orange.
At primary degree wave A would be an expanded flat correction because wave (B) black is a 123% correction of wave (A) black. We would expect wave (C) black to most likely reach 1.618 the length of wave (A) black a 967.
Within wave (C) black no second wave correction may move beyond the start of its first wave. This wave count is clearly invalidated with any movement above 1,422.38.
Second Alternate.
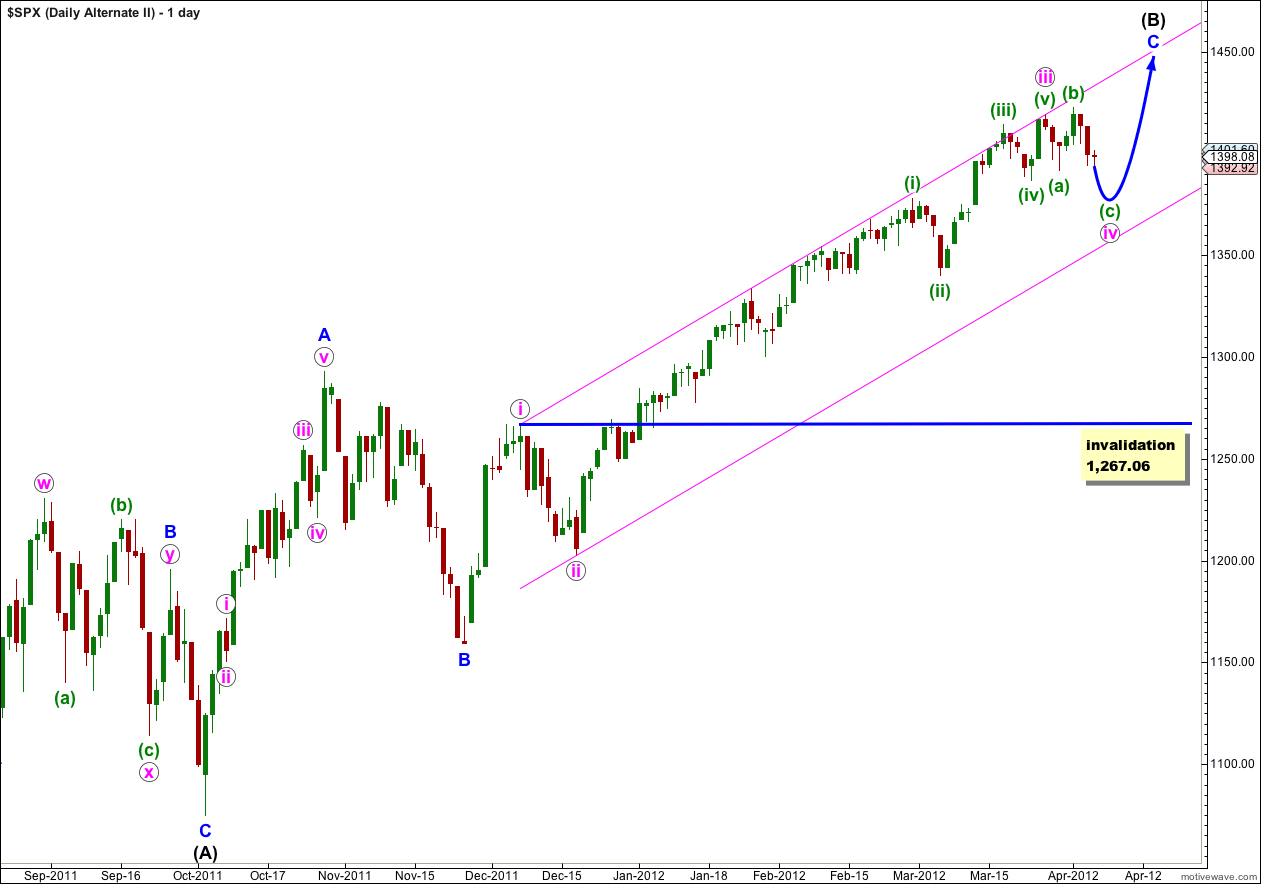
I have previously used a wave count which sees wave (B) black as a single zigzag and not a double. I discarded this idea because wave A blue looks much more like a three than a five, and subdivisions fit much better as a three. Trying to see this as a five is possible on the hourly chart, but the third wave looks strange. Because it does not have the right look the probability of this wave count is fairly low.
However, we should keep it in mind again because of the implication of its parallel channel.
This channel is drawn using Elliott’s first technique: draw the first trend line from the highs of waves i to iii pink, then place a parallel copy upon the low of ii pink. The upper trend line drawn this way has been adhered to closely multiple times, with the smallest of overshoots for the third wave of the third wave. This channel looks very good indeed, and there is no channel breach and no confirmation of a trend change for this alternate.
If this wave count is correct then we may expect an expanded flat for wave iv pink to complete with a little more downwards movement. The target would be the same as on the hourly chart, and the subdivisions (with the exception of the degree of labeling) would also be the same.
Thereafter, we would expect a final fifth wave upwards. We would still expect wave (B) black to end before 1,464, and to be only up to 138% the length of wave (A) black.