
The S&P 500 moved higher to end the trading week, which is what our last analysis had expected.
Targets have been slightly recalculated and we should expect more of the same until our targets are reached.
We still have only one daily wave count. To end the trading week I have our main hourly wave count, and an alternate which we may use if the main wave count is invalidated on the hourly chart.
Click on the charts below to enlarge.
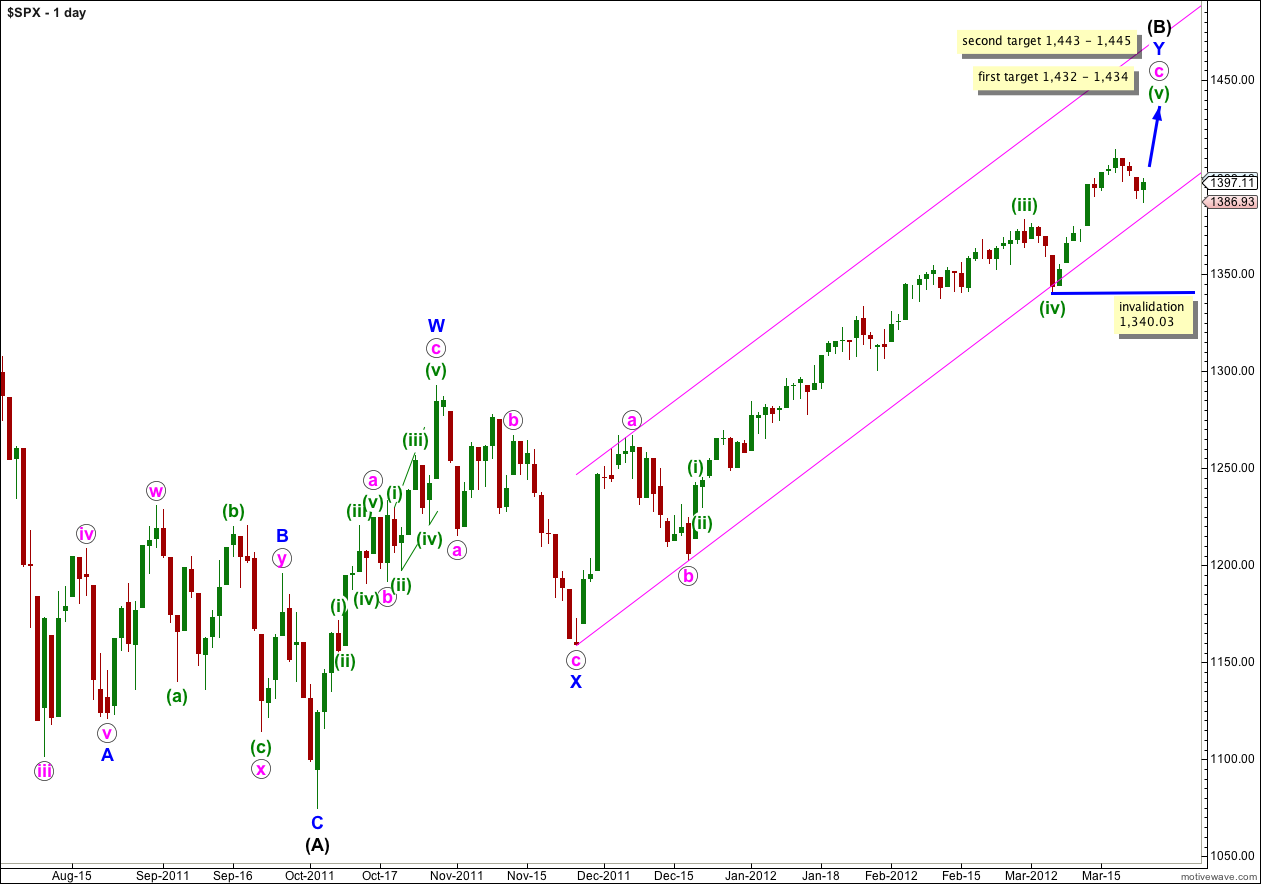
This wave count sees the S&P 500 as within a final fifth wave upwards to complete a large correction at intermediate (black) degree. If wave Y blue is to have a Fibonacci time relationship then it may take another 8 sessions to complete, lasting a Fibonacci 89 days. Please note though that Fibonacci time relationships are not as reliable as price ratios, and this expectation of another 8 sessions is a rough guide only.
Wave (B) black is correcting the three wave structure of wave (A) black within a flat correction at primary degree. The maximum common length for wave (B) black in relation to wave (A) black is 138%. This would be achieved at 1,464 and it is likely we shall see a trend change before this price point is reached.
At 1,432 wave (v) green would reach 0.618 the length of wave (iii) green. At 1,434 wave v orange within wave (v) green would reach equality with wave iii orange. This is our first target for upwards movement to end.
If price continues through the first target, and the structure requires further upwards movement to complete it, the second target is at 1,445 where wave (v) green would reach 2.618 the length of wave (i) green. Also at 1,445 wave v orange within wave (v) green would reach 1.618 the length of wave iii orange.
Within wave (v) green no second wave correction may move beyond the start of the first wave. This wave count is invalidated with movement below 1,340.03.
We should keep drawing the parallel channel on the daily chart about the zigzag of wave Y blue. Draw the first trend line from the start of Y blue to the low labeled b pink, then place a parallel copy on the high of a pink. Only when this channel is breached by a full daily candlestick below it shall we have confirmation of a big trend change, and until that time we should expect upwards movement to continue.
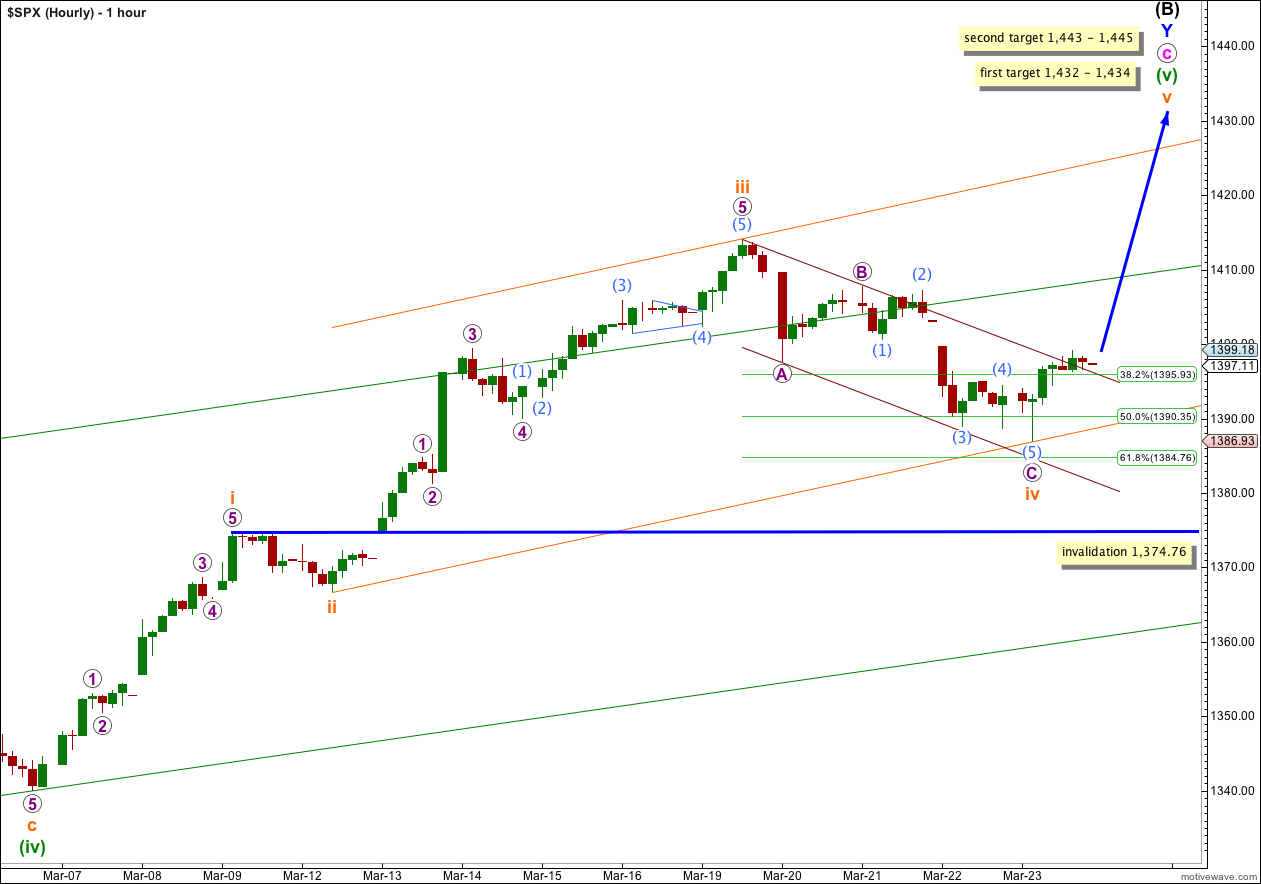
Wave C purple to end wave iv orange correction has moved lower, ending closer to the 0.618 Fibonacci ratio of wave iii orange.
There is still no Fibonacci ratio between waves A and C purple.
Within wave C purple ratios are: wave (3) aqua is 0.32 points short of 2.618 the length of wave (1) aqua, and wave (5) aqua is now just 0.47 points short of equality with wave (1) aqua.
With a lower end to wave iv orange the targets needed to be recalculated.
At 1,432 wave (v) green would reach 0.618 the length of wave (iii) green. At 1,434 wave v orange would reach equality with wave iii orange. This is our first 2 point target zone.
If price continues to rise through this first target, or if when price reaches it the structure of wave (v) green is incomplete, then we shall use the second target.
At 1,443 wave v orange would reach 1.618 the length of wave i orange. At 1,445 wave (v) green would reach 2.618 the length of wave (i) green. This is our second 2 point target zone.
If wave iv orange extended further it may not move into wave i orange price territory. This wave count is invalidated with movement below 1,374.76.
The small parallel channel drawn about the zigzag of wave iv orange has not been very clearly breached. When we have a clearer breach by upwards movement then we may have a little more confidence that wave v orange is underway.
If price moves below 1,374.76 invalidating this hourly wave count then we may use the alternate below.
Alternate Hourly Wave Count.
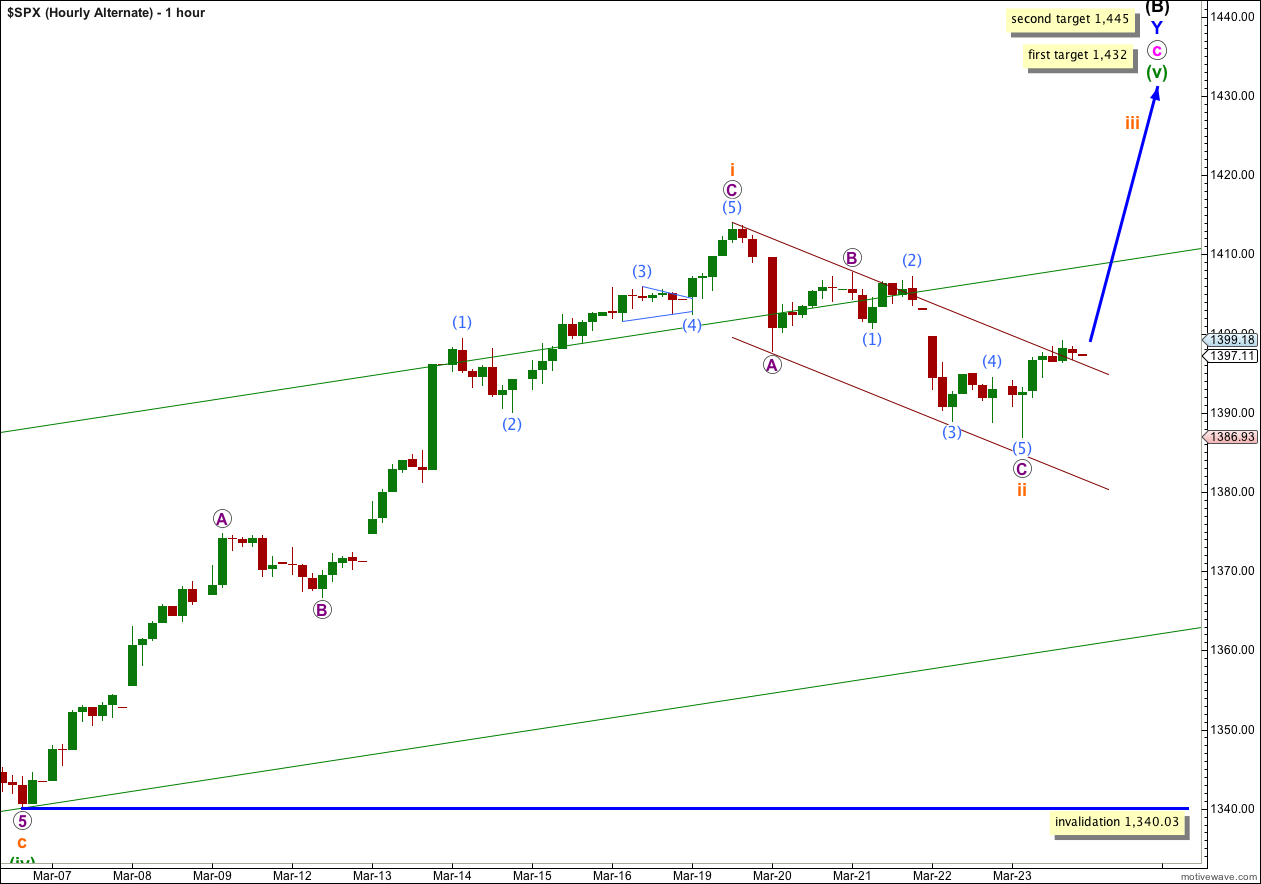
There are two structural possibilities for wave (v) green. The main hourly wave count looks at the more likely possibility that it is unfolding as a simple impulse, this alternate looks at the less likely possibility that it is unfolding as an ending diagonal.
An ending diagonal requires all subwaves to subdivide into zigzags.
At this stage wave ii orange may be a complete zigzag, but it may not be over here and could continue lower. If price moves below 1,374.76 this will be our only valid wave count.
It is too early to say if the diagonal would be expanding or contracting, but with the length of wave i orange so far it would more likely to be contracting.
At this stage wave ii orange is only a 37% correction of wave i orange. The more common length for second and fourth wave of diagonals is to be between 0.66 to 0.81 of the first and third waves respectively, and if this wave count is correct it is reasonably likely that wave ii orange could continue lower to end between 1,365 to 1,354.
The small channel containing the zigzag for wave ii orange is not yet breached clearly. Until it is breached we must understand that there is a reasonable probability that wave ii orange could continue to move lower.
Wave ii orange may not move below the start of wave i orange. This wave count is invalidated with movement below 1,340.03.
If this alternate wave count is invalidated with downwards movement then there will be a high probability that the S&P 500 has had a major trend change at intermediate degree; that wave (B) black in its entirety is over and wave (C) black has begun and will take price to new lows below 1,074.77.