
Weekly Dow analysis is now paid content for members only. We are offering this for a very reasonable fee of $5 per month. If you wish to sign up to receive Hugo’s weekly Dow analysis for $5 per month click the big orange button on the right hand sidebar ———————————->
The Dow has continued lower since our last analysis. Both the hourly wave counts remain valid.
We will use invalidation / confirmation points to work with our two wave counts.
Elliott Wave chart analysis for the DJIA for 23rd March, 2012. Please click on the charts below to enlarge.
We should always assume the trend remains the same, until proved otherwise. At this stage we do not have confirmation of a trend change. Movement below 12,734.86 would confirm a trend change.
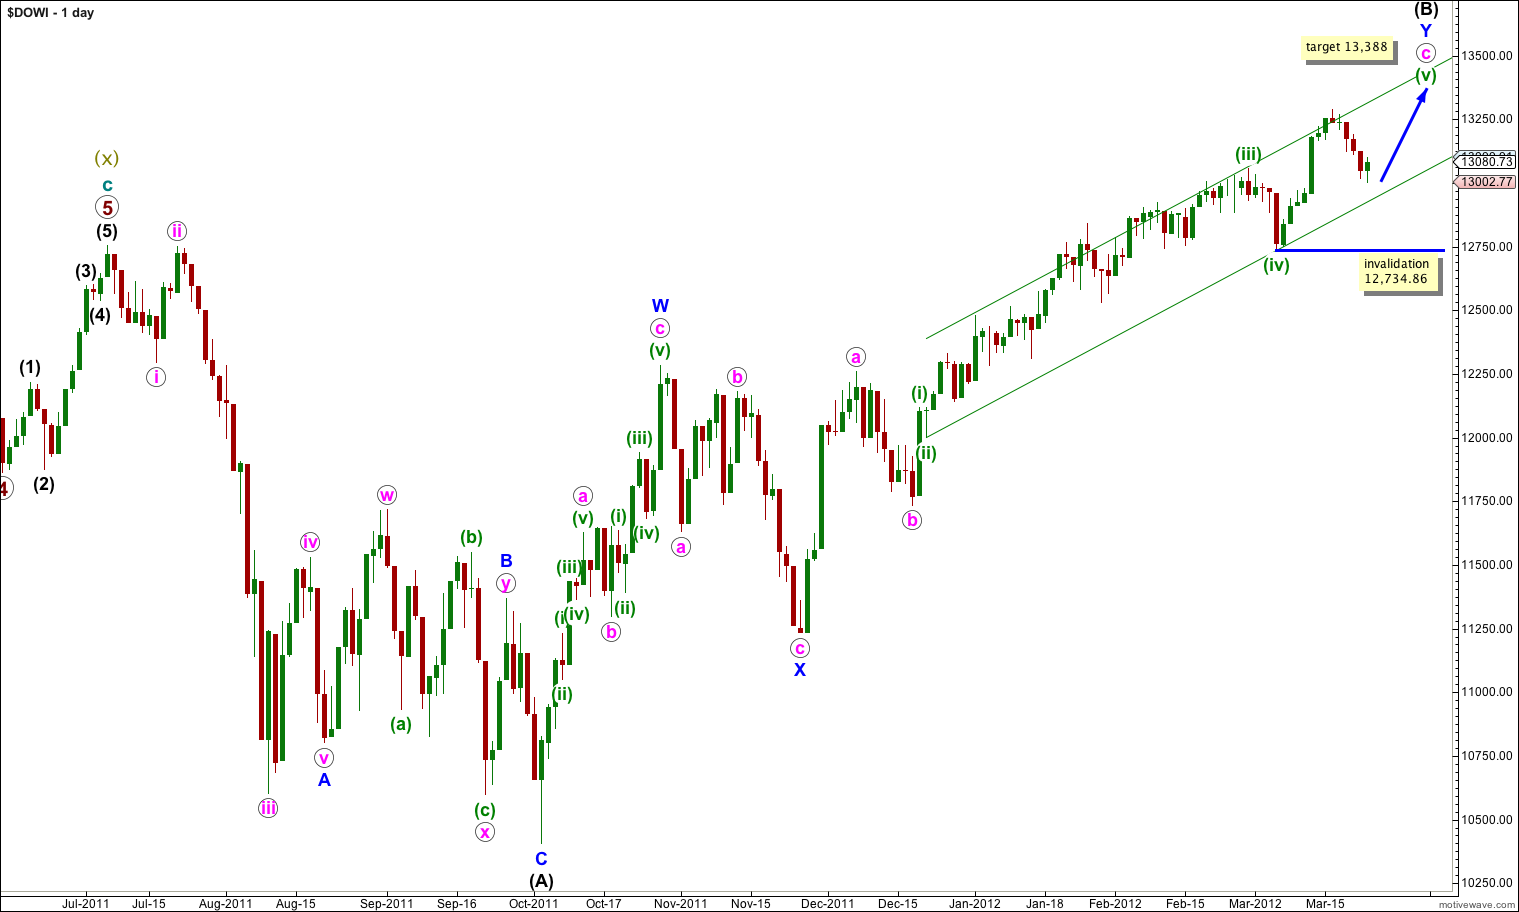
This main daily wave count sees wave (B) black as a double zigzag correction.
Waves (i) through (iv) green are seen as complete. Wave (v) green may still be unfolding.
At 14,205.82 wave (B) black would reach 138% the length of wave (A) black which is the typical maximum for a B wave within a flat correction. We are likely to see a trend change occur before price reaches 14,205.82.
At 13,388 wave (v) green would reach 0.618 the length of wave (iii) green.

This main hourly sees wave (v) green possibly unfolding as an ending diagonal that would need to see all the sub waves subdivide into zigzags.
We have completed zigzags for waves i and ii orange, although wave ii orange may extend lower.
A ratio within wave i orange is: wave C purple is 3.92 points longer than 1.618 the length of wave A purple.
There is no adequate Fibonacci ratio within wave ii orange for wave C purple with wave A purple.
Further upwards movement is therefore expected to complete wave (v) green which should then see the correction for wave (B) black complete.
Movement above 13,288.33 would confirm this wave count as the alternate hourly would then be invalidated.
A possible target for wave iii orange is at 13,556.10 where wave iii orange would reach equality with wave i orange.
Movement below 12,735.16 would invalidate this wave count as wave ii orange may not move beyond the start of wave i orange. At that stage we would use the alternate wave count below and expect we have seen a trend change.
Alternate Hourly Wave Count.

This alternate hourly wave count expects that we have seen the end to wave (B) black and therefore a trend change has occurred.
A ratio within wave Y blue is: wave c pink is 106.36 points shorter than 1.618 the length of wave a pink.
Ratios within wave c pink are: wave (iii) green is 52.23 points longer than 2.618 the length of wave (i) green and there is no adequate Fibonacci ratio for wave (v) green with either of waves (i) or (iii) green.
Ratios within wave (v) green are: wave iii orange has no adequate Fibonacci ratio to wave i orange and wave v orange is 1.79 points shorter than .382 the length of wave iii orange.
Ratios within wave i orange within wave (C) black are: there is no adequate Fibonacci ratio for wave 3 purple with wave 1 purple and wave 5 purple is 13.59 points shorter than 2.618 the length of wave 1 purple.
We are likely to see wave ii orange move to at least the .618 Fibonacci retracement of wave wave i orange. This ratio also aligns well with the fourth wave of one lesser degree which is a common area where we see corrections complete.
Final confirmation of the trend change is with movement below 12,735.16 as the downwards movement then can not be a second wave correction within wave (v) green anymore. This would also see our main hourly wave count invalidated.
Upwards movement above 13,288.33 would invalidate this wave count as no second wave correction within wave (C) black may move beyond the start of the first wave.