
As expected the S&P 500 began Monday’s session with a little downwards movement, which completed a small triangle structure, and then price moved upwards out of the triangle. Upwards movement fell short of our short term target of 1,419 – 1,423 by 5 points.
I expect the next structure to unfold has now begun. We may expect it to last a couple of sessions, perhaps a little longer.
Click on the charts below to enlarge.
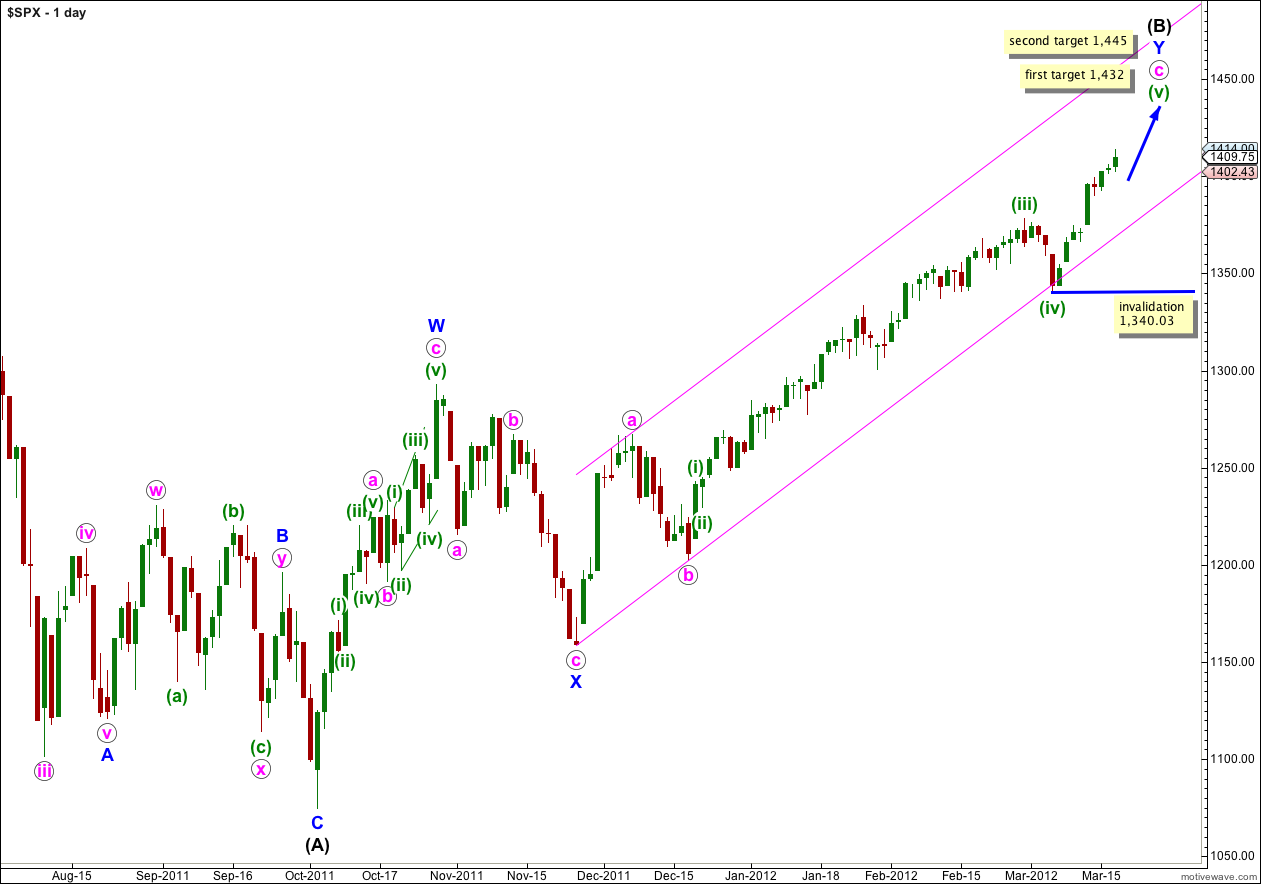
This main wave count, and our alternate below, both see the S&P 500 as within a final fifth wave upwards to complete a large correction at intermediate (black) degree. If wave Y blue is to have a Fibonacci time relationship then it may take another 12 sessions to complete, lasting a Fibonacci 89 days. Please note though that Fibonacci time relationships are not as reliable as price ratios, and this expectation of another 12 sessions is a rough guide only.
Wave (B) black is correcting the three wave structure of wave (A) black within a flat correction. The maximum common length for wave (B) black in relation to wave (A) black is 138%. This would be achieved at 1,464 and it is likely we shall see a trend change before this price point is reached.
At 1,432 wave (v) green would reach 0.618 the length of wave (iii) green. This is our first target for upwards movement to end.
If price continues through the first target, and the structure requires further upwards movement to complete it, the second target is at 1,445 where wave (v) green would reach 2.618 the length of wave (i) green.
Within wave (v) green no second wave correction may move beyond the start of the first wave. This wave count is invalidated with movement below 1,340.03.
We should keep drawing the parallel channel on the daily chart about the zigzag of wave Y blue. Draw the first trend line from the start of Y blue to the low labeled b pink, then place a parallel copy on the high of a pink. Only when this channel is breached by a full daily candlestick below it shall we have confirmation of a big trend change, and until that time we should expect upwards movement to continue.
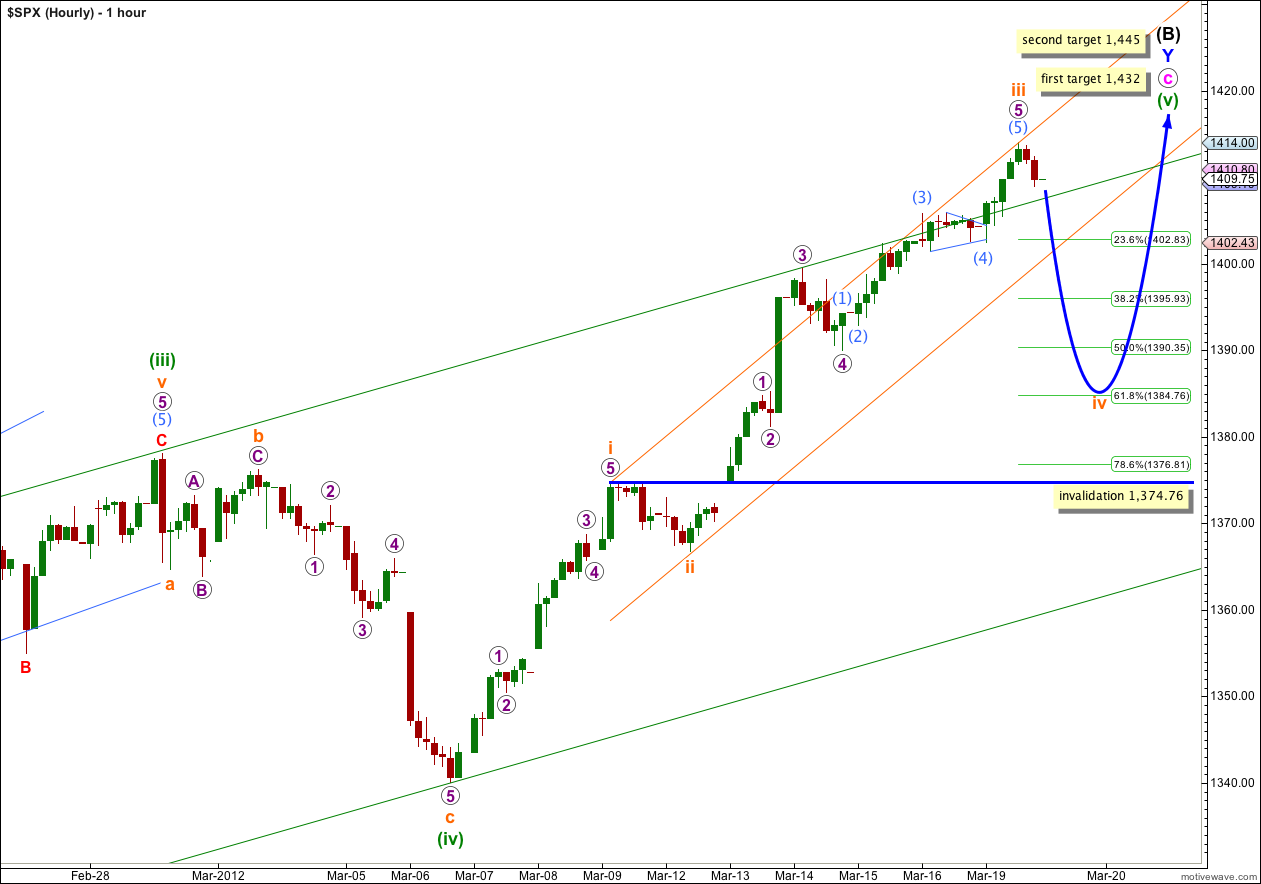
The small triangle for wave (4) aqua completed as expected and wave (5) aqua upwards thereafter unfolded with upwards movement. Within wave 5 purple there are no Fibonacci ratios between aqua waves (1), (3) and (5).
Wave iii orange has no Fibonacci ratio to wave i orange. This means it is increasingly likely that wave v orange will exhibit a Fibonacci ratio to either of i or iii orange.
Wave ii orange was a shallow zigzag correction. Given the guideline of alternation we may expect wave iv orange to most likely be a flat, combination or possibly a triangle. It is likely to be a deep correction of wave iii orange and at this early stage the 0.618 Fibonacci ratio at 1,384.76 is our target.
Wave iv orange may last two sessions or so.
Wave iv orange may not move into wave i orange price territory. This wave count is invalidated with movement below 1,374.76.
Alternate Daily Wave Count.
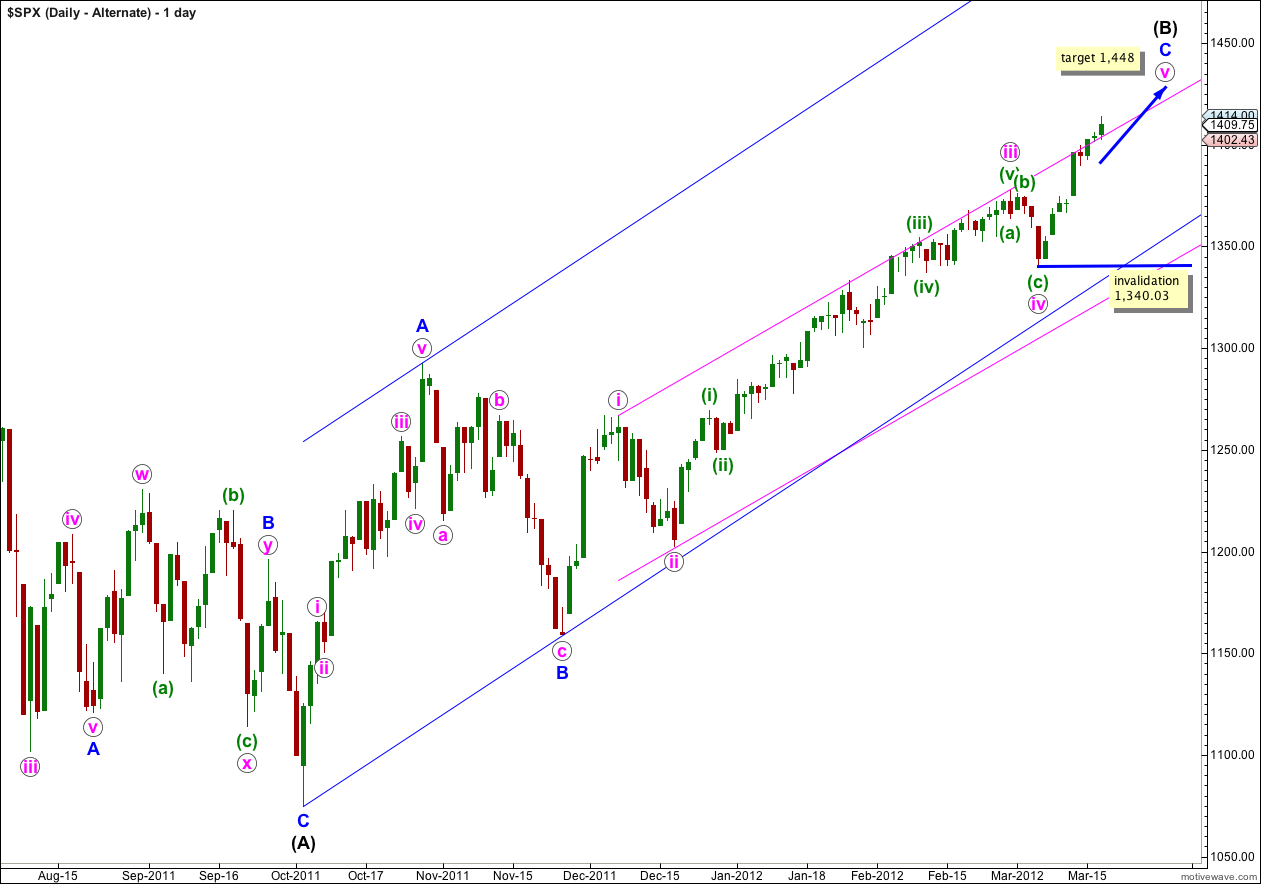
This alternate wave count differs from the main wave count in the structure of wave (B) black. The main wave count sees wave (B) black as a double zigzag, and this alternate sees it as a single zigzag. Both wave counts see a final upwards fifth wave unfolding.
This alternate has exactly the same subdivisions as the main on the hourly chart, with the exception of labeling being one degree higher.
Within this wave count wave iii pink is just 0.28 points longer than 1.618 the length of wave i pink. It is almost a perfect Fibonacci ratio.
This alternate wave count has a lower probability than the main wave count because the subdivision of wave A blue upwards is not as satisfactory.
At 1,448 wave v pink would reach equality with wave i pink.
There will probably be no Fibonacci ratio between waves A and C blue within (B) black.
Within wave v pink no second wave correction may move beyond the start of the first wave. This wave count is invalidated with movement below 1,340.03.