
As our main wave count expected the S&P 500 moved higher to end the trading week. Most of Friday’s sideways movement looks like a low degree fourth wave triangle unfolding when viewed on the 5 minute chart. I expect this structure will complete early on Monday’s session and price should shoot out strongly in the main trend direction when it is done.
We should expect price to continue to rise towards our targets. Both our main and alternate wave counts expect the same movement next.
Click on the charts below to enlarge.
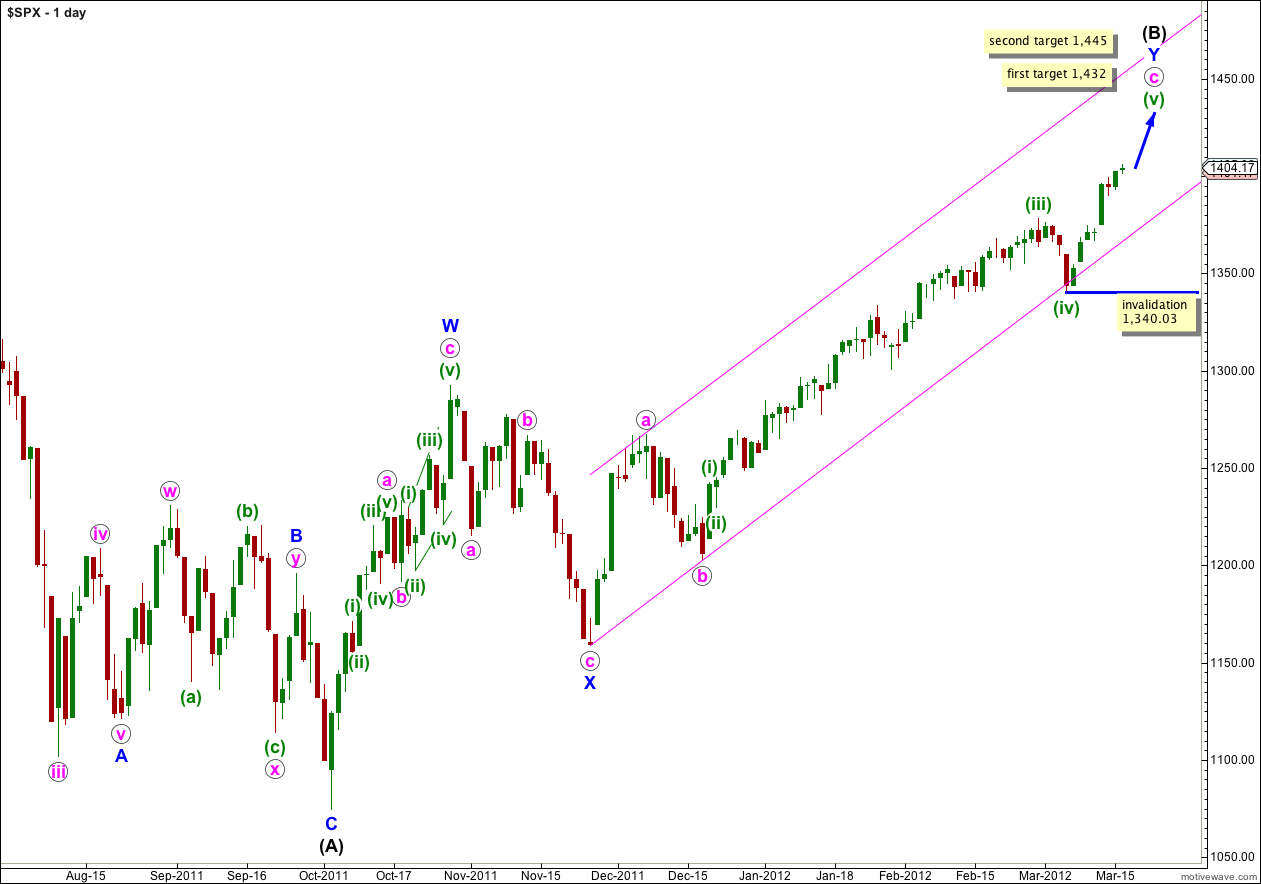
This main wave count, and our alternate below, both see the S&P 500 as within a final fifth wave upwards to complete a large correction at intermediate (black) degree. If wave Y blue is to have a Fibonacci time relationship then it may take another 13 sessions to complete, lasting a Fibonacci 89 days.
Wave (B) black is correcting the three wave structure of wave (A) black within a flat correction. The maximum common length for wave (B) black in relation to wave (A) black is 138%. This would be achieved at 1,464 and it is likely we shall see a trend change before this price point is reached.
At 1,432 wave (v) green would reach 0.618 the length of wave (iii) green. This is our first target for upwards movement to end.
If price continues through the first target, and the structure requires further upwards movement to complete it, the second target is at 1,445 where wave (v) green would reach 2.618 the length of wave (i) green.
Within wave (v) green no second wave correction may move beyond the start of the first wave. This wave count is invalidated with movement below 1,340.03.
We should keep drawing the parallel channel on the daily chart about the zigzag of wave Y blue. Draw the first trend line from the start of Y blue to the low labeled b pink, then place a parallel copy on the high of a pink. Only when this channel is breached by a full daily candlestick below it shall we have confirmation of a big trend change, and until that time we should expect upwards movement to continue.
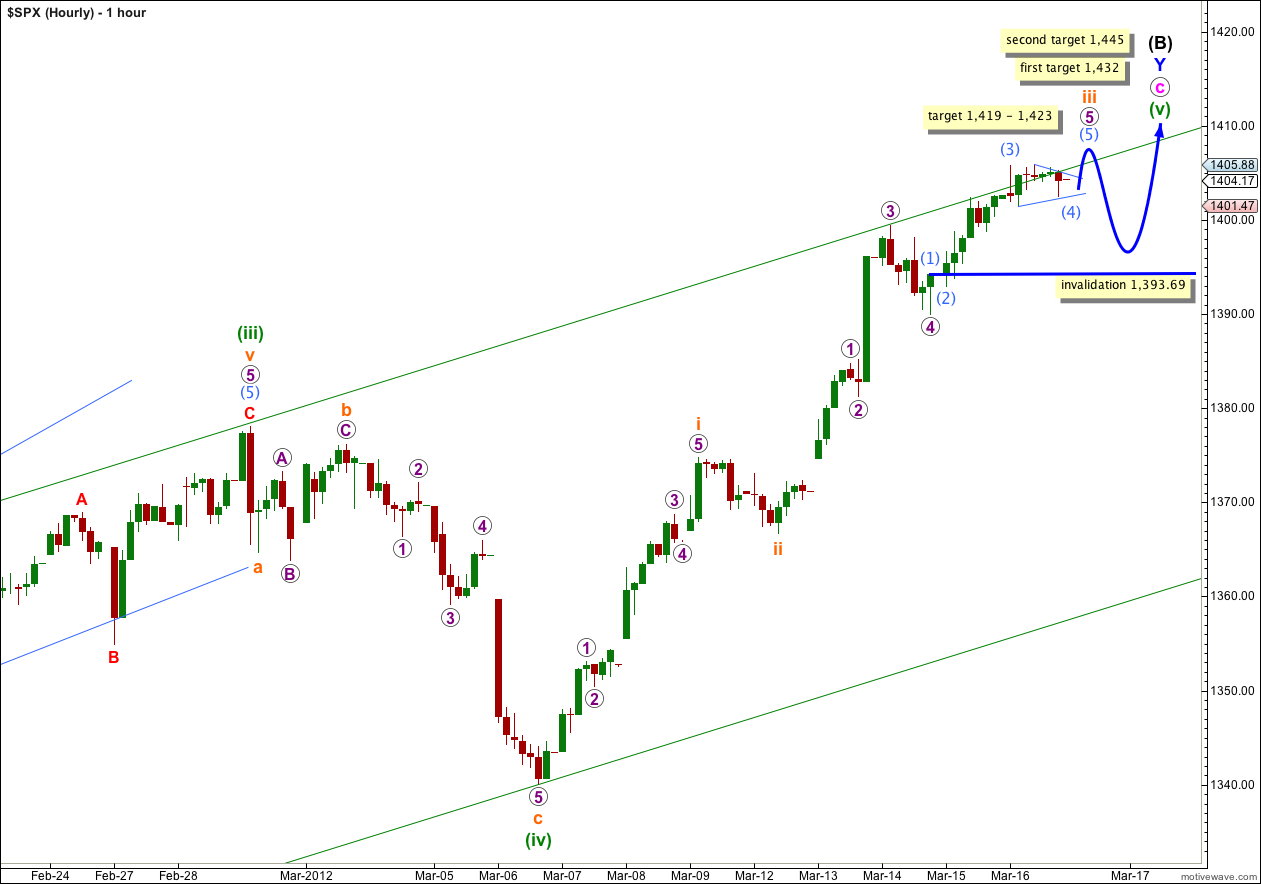
I expect that wave iii orange is still incomplete. For most of Friday’s session price moved sideways, and on the 5 minute chart this movement looks like a triangle suggesting a fourth wave.
This triangle is probably wave (4) aqua. It is incomplete; the final wave E downwards needs to unfold. For the triangle to remain valid price cannot fall below 1,402.54. If price remains above this point and wave E down completes, then we have a high probability that the next movement will be strongly upwards.
When the triangle is complete then wave (5) aqua should begin with strong upwards movement out of the triangle towards the target for iii orange to end.
At 1,419 wave 5 purple would reach 1.618 the length of wave 3 purple. At 1,423 wave iii orange would reach 1.618 the length of wave i orange. This gives us a 4 point target zone for this upwards wave to end. I suspect this target zone is a little optimistic and upwards movement may fail to reach it by a little.
Within wave 5 purple wave (4) aqua may not move into wave (1) aqua price territory. This wave count is invalidated with movement below 1,393.69 (the high of wave (1) aqua was determined on a 5 minute chart).
Keep drawing the parallel channel about wave c pink on the hourly chart. Draw the first trend line from the lows of (ii) green (look for this on the daily chart) to (iv) green, then place a parallel copy on the high of (iii) green. We may expect upwards movement to follow along the upper trend line to complete wave iii orange.
Alternate Daily Wave Count.
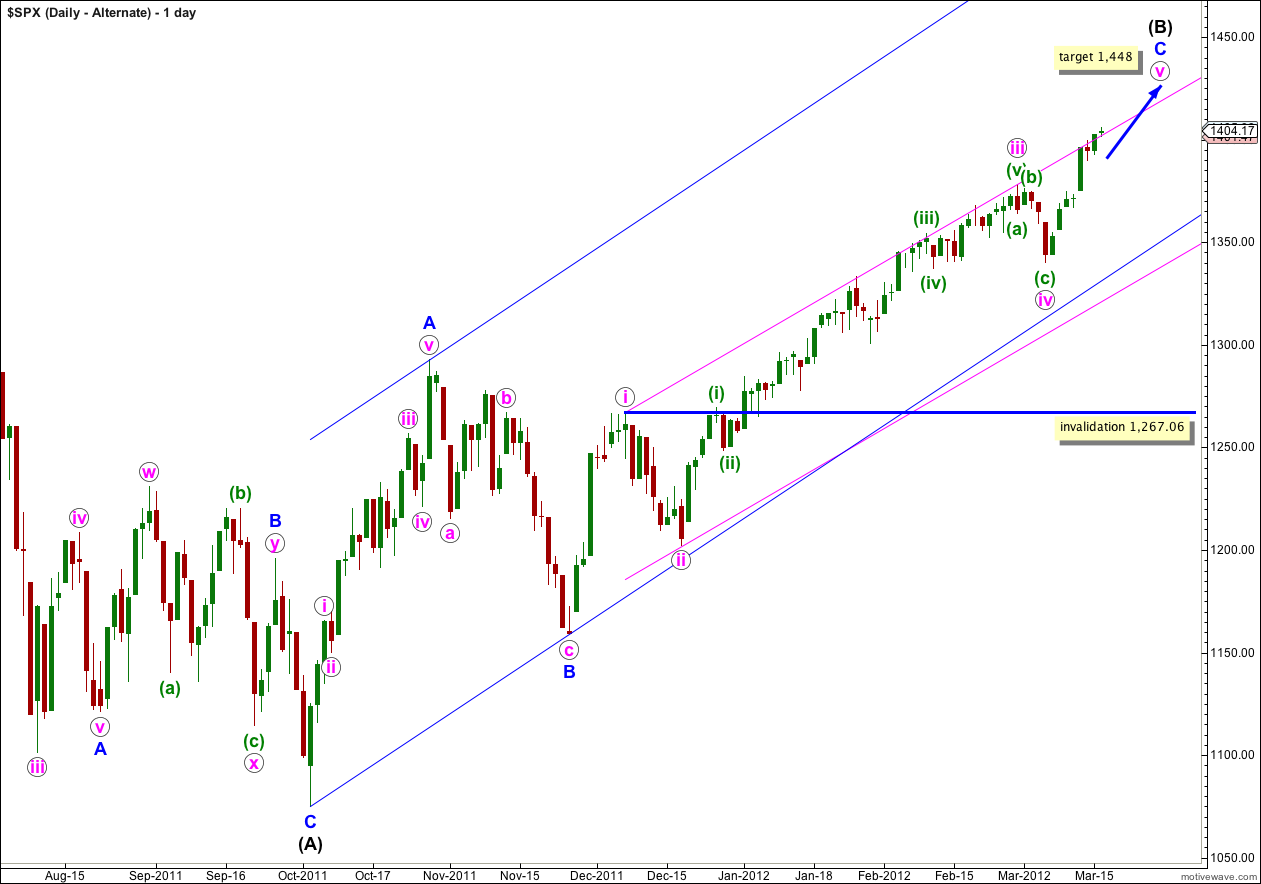
This alternate wave count differs from the main wave count in the structure of wave (B) black. The main wave count sees wave (B) black as a double zigzag, and this alternate sees it as a single zigzag. Both wave counts see a final upwards fifth wave unfolding.
This alternate has exactly the same subdivisions as the main on the hourly chart, with the exception of labeling being one degree higher.
Within this wave count wave iii pink is just 0.28 points longer than 1.618 the length of wave i pink. It is almost a perfect Fibonacci ratio.
This alternate wave count has a lower probability than the main wave count because the subdivision of wave A blue upwards is not as satisfactory.
At 1,448 wave v pink would reach equality with wave i pink.
There will probably be no Fibonacci ratio between waves A and C blue within (B) black.
If wave iv pink extends any lower or further sideways as a double flat or double combination, then it may not move into wave i pink price territory. This wave count is invalidated with movement below 1,267.06.