
Movement to a new high has invalidated our hourly wave counts. We have very clearly not had a trend change as we did not get confirmation of this trend change, and the possibility of new highs did remain.
I have reworked the main wave count. We shall continue to use the alternate as well, but at this stage they both expect exactly the same movement and the same structure. Targets are within three points and there is little difference between the two now.
Click on the charts below to enlarge.
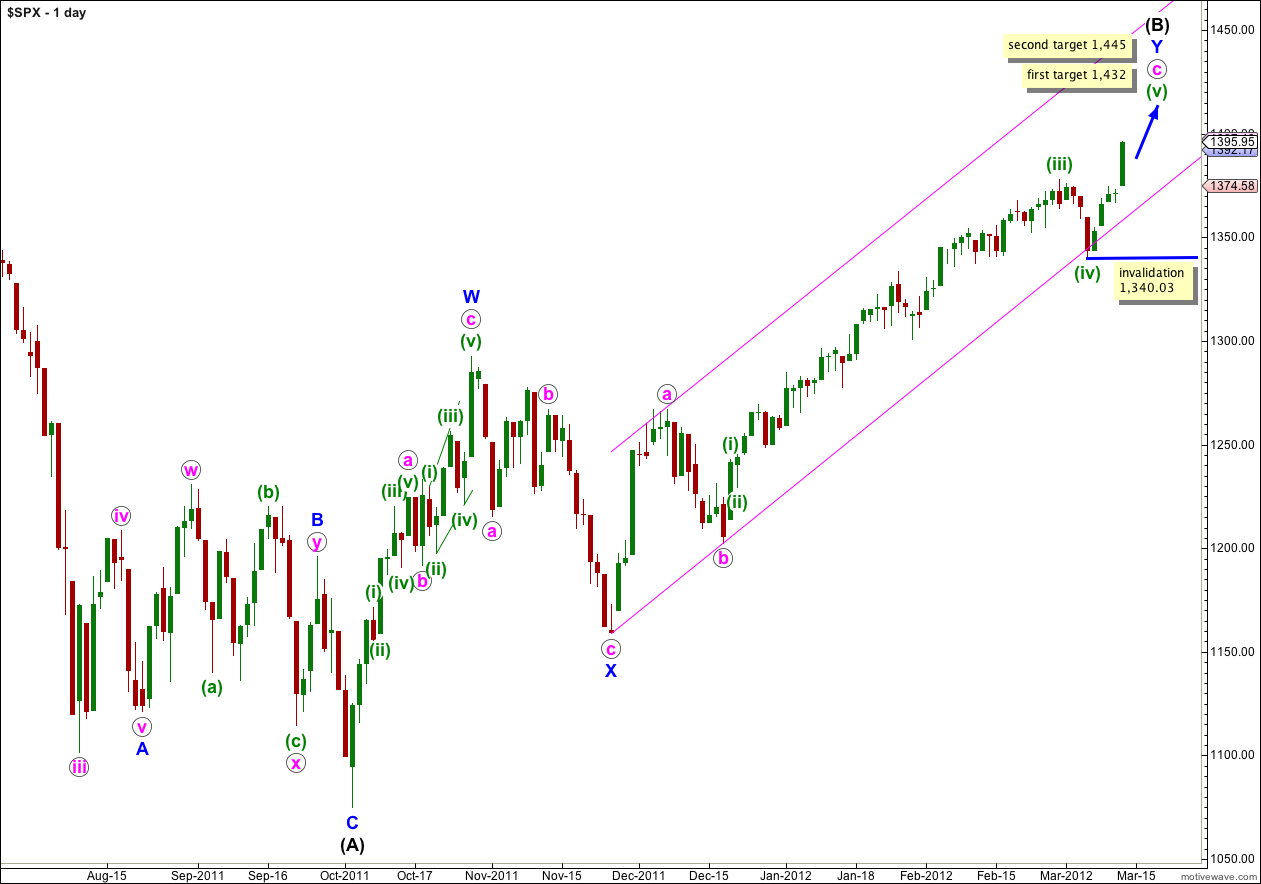
It is possible that the downwards movement of last week was a fourth wave correction at green degree. With this scenario though there are no Fibonacci ratios between waves (i) and (iii) green.
Wave (B) black is correcting the three wave structure of wave (A) black within a flat correction. The maximum common length for wave (B) black in relation to wave (A) black is 138%. This would be achieved at 1,464 and it is likely we shall see a trend change before this price point is reached.
At 1,432 wave (v) green would reach 0.618 the length of wave (iii) green. This is our first target for upwards movement to end.
If price continues through the first target, and the structure requires further upwards movement to complete it, the second target is at 1,445 where wave (v) green would reach 2.618 the length of wave (i) green.
Within wave (v) green no second wave correction may move beyond the start of the first wave. This wave count is invalidated with movement below 1,340.03.
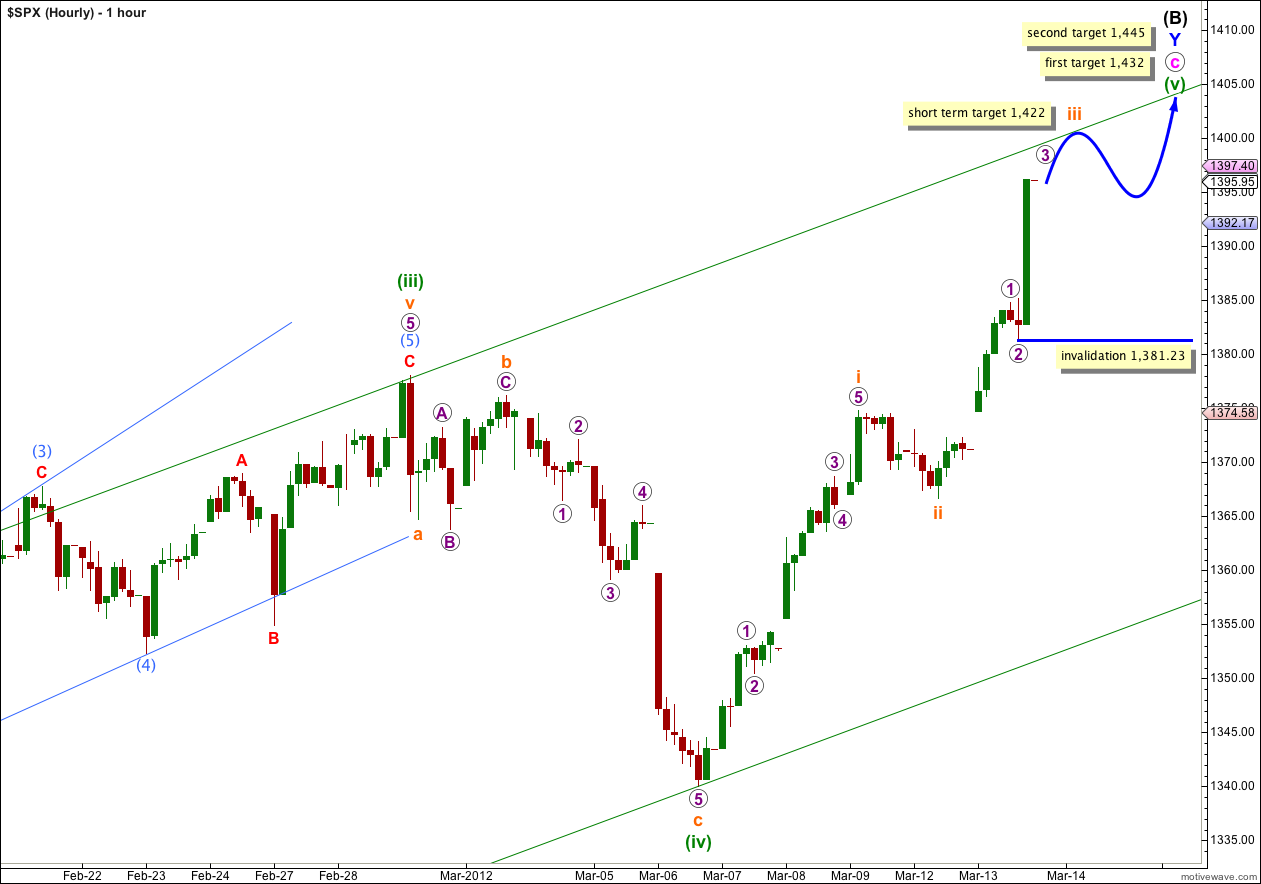
With movement above 1,378.04 the downwards wave labeled (iv) green is confirmed as a three wave structure, and not a five. Wave (iv) green is a zigzag, and wave c orange is just 1.27 points longer than 2.618 the length of wave a orange.
Wave (v) green must subdivide into a five wave structure, either an ending diagonal or an impulse. So far upwards movement is unfolding as an impulse and we may expect this to continue.
Strong upwards movement towards the end of Wednesday’s session increased in momentum, this looks like the middle of a third wave.
At 1,422 wave iii orange would reach 1.618 the length of wave i orange. This short term target may be reached within another one to three sessions.
Ratios within wave i orange are: wave 3 purple has no Fibonacci ratio to wave 1 purple, and wave 5 purple is just 0.4 points longer than 2.618 the length of wave 1 purple.
Within wave 3 purple of wave iii orange no second wave correction may move beyond the start of the first wave. This wave count is invalidated with movement below 1,381.23.
Alternate Daily Wave Count.
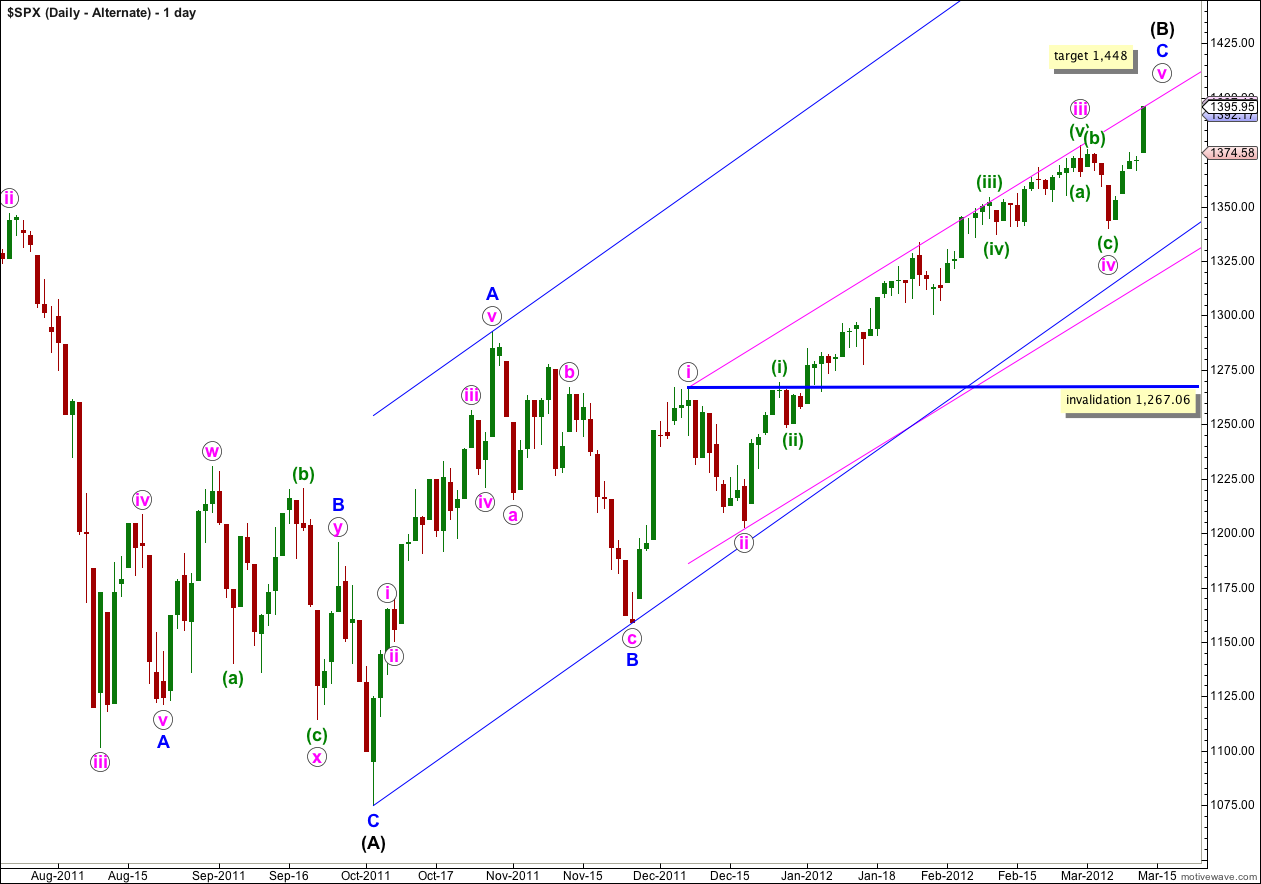
This alternate wave count also sees downwards movement from last week as a fourth wave correction.
Within this wave count wave iii pink is just 0.28 points longer than 1.618 the length of wave i pink. Wave i pink is 108.4 points in length and wave iii pink is 175.67 points in length, and this difference of 0.28 points is extremely small. It is almost a perfect Fibonacci ratio. This adds slight weight to this wave count, or at least to this portion of it.
However, this alternate wave count still has a lower probability than the main wave count because the subdivision of wave A blue upwards is not as satisfactory. But at this stage it makes little difference, because they both expect upwards movement to complete a final fifth wave.
At 1,448 wave v pink would reach equality with wave i pink.
There will probably be no Fibonacci ratio between waves A and C blue within (B) black.
If wave iv pink extends any lower or further sideways as a double flat or double combination, then it may not move into wave i pink price territory. This wave count is invalidated with movement below 1,267.06.