
While our main hourly wave count remains valid, Friday’s movement was not what I had expected.
If we have had a trend change a few days ago then we should see new lows next week. If we have not then I would expect our alternate hourly wave count to be confirmed on Monday.
Click on the charts below to enlarge.
While price does not move above 1,378.04 this wave count will remain valid. If wave (B) black is over and wave (C) black has begun then we should see movement below this parallel channel next week. That would provide confirmation of a trend change.
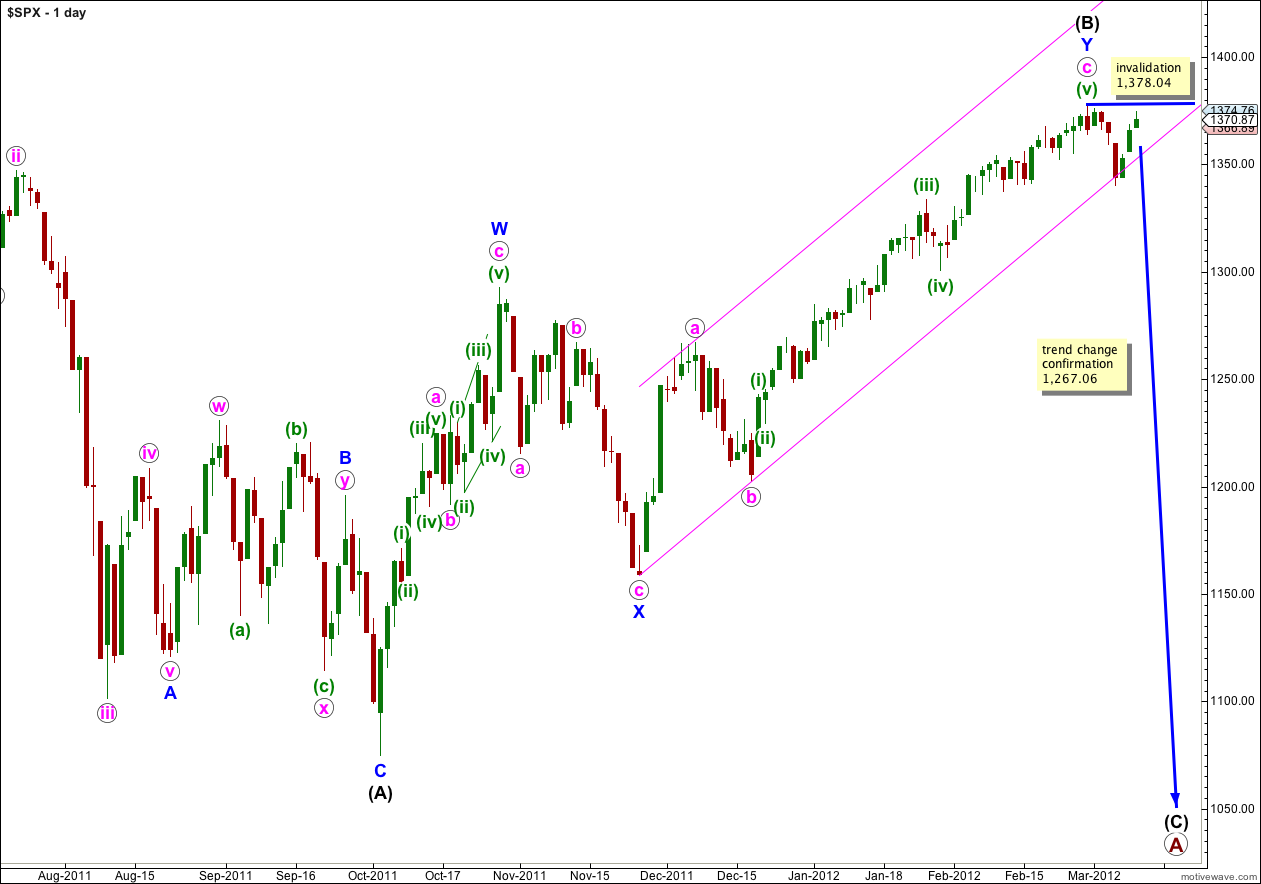
Double zigzag structures (as wave (B) black is labeled) are reasonably common. The only corrective structure which begins with two zigzags is a rare triple zigzag. The rarity of triples means that when the second zigzag is over the probability that the entire correction is over is very high indeed. The next wave is most likely to be wave (C) black downwards.
At primary degree wave A is unfolding as a flat correction. With wave (B) black now 108% the length of wave (A) black primary wave A could be either an expanded or running flat. Expanded flats are very common and running flats reasonably rare. The probability that wave (C) black will move below the end of wave (A) black as for an expanded flat correction is extremely high.
Within wave (C) black no second wave correction may move beyond the start of the first wave. This wave count is invalidated with movement above 1,378.04.
Movement below 1,267.06 would invalidate the alternate daily wave count and provide us with full and final confirmation that the S&P 500 has had a major trend change which is likely to see new lows.
Main Hourly Wave Count.
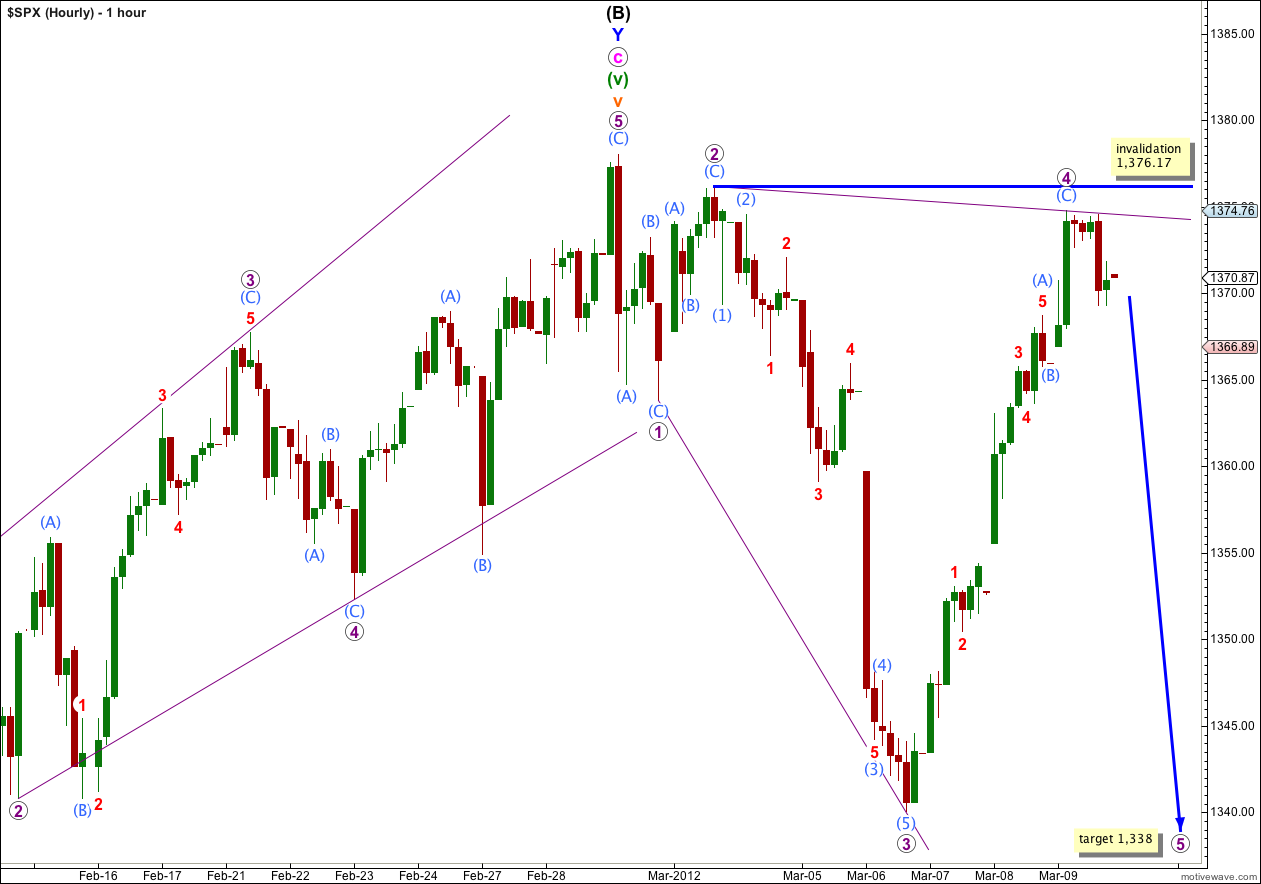
If we have had a large trend change then this downwards movement is either a leading expanding diagonal, or my analysis of wave 3 purple is incorrect and a five down ended at the low of 1,340.03. I have charted this second option, but I have little confidence in it because its subdivisions don’t fit well on the 5 minute chart and it has the wrong look on the hourly chart. It’s more likely this structure unfolding is a diagonal.
Within a diagonal we would expect waves 2 and 4 to correct to between 0.66 and 0.81 of waves 1 and 3 respectively. Wave 2 purple is an 87% correction of wave 1 purple, and wave 4 purple is now a 96% correction of wave 3 purple. So if this is a diagonal it is not typical.
I expected wave 4 purple to be an obvious zigzag, looking more like wave 1 purple. At this stage it has a corrective wave count but it is not looking like a typical zigzag. There is no Fibonacci ratio between waves (A) and (C) aqua.
The diagonal is expanding and wave 5 purple should reach at least equality with wave 3 purple giving us a minimum expectation for downwards movement to 1,338. Leading diagonals may not have truncated fifth waves and this wave count requires a new low below 1,340.03 to remain valid.
Wave 4 purple of the diagonal may not move beyond the end of wave 2 purple. This wave count is invalidated with movement above 1,376.17.
Alternate Hourly Wave Count.
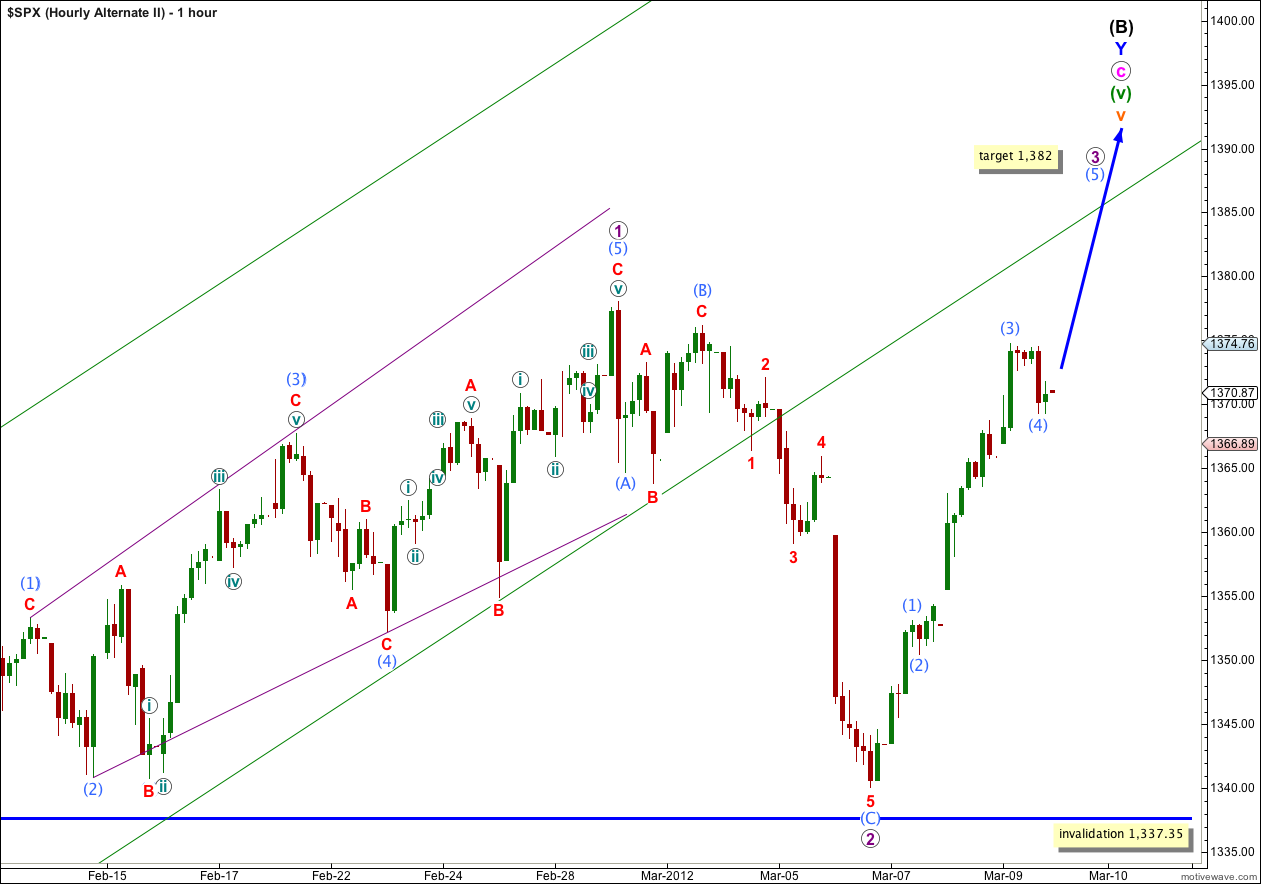
It is still possible, but unlikely, that wave v orange is incomplete.
Wave 1 purple is a leading expanding diagonal. Wave 2 purple is a zigzag. Wave 3 purple must subdivide into an impulse and at this stage it is incomplete. Wave 3 must move beyond the end of wave 1 purple and this wave count requires a new high above 1,378.04 to remain valid.
At 1,382 wave (5) aqua would reach equality with wave (1) aqua. This is also very close to where wave 3 purple would reach equality with wave 1 purple.
This wave count has a low probability because the green parallel channel containing upwards movement since the 20th of December 2011 has been clearly and strongly breached. This channel breach is significant and would normally indicate a trend change.
Alternate Daily Wave Count.
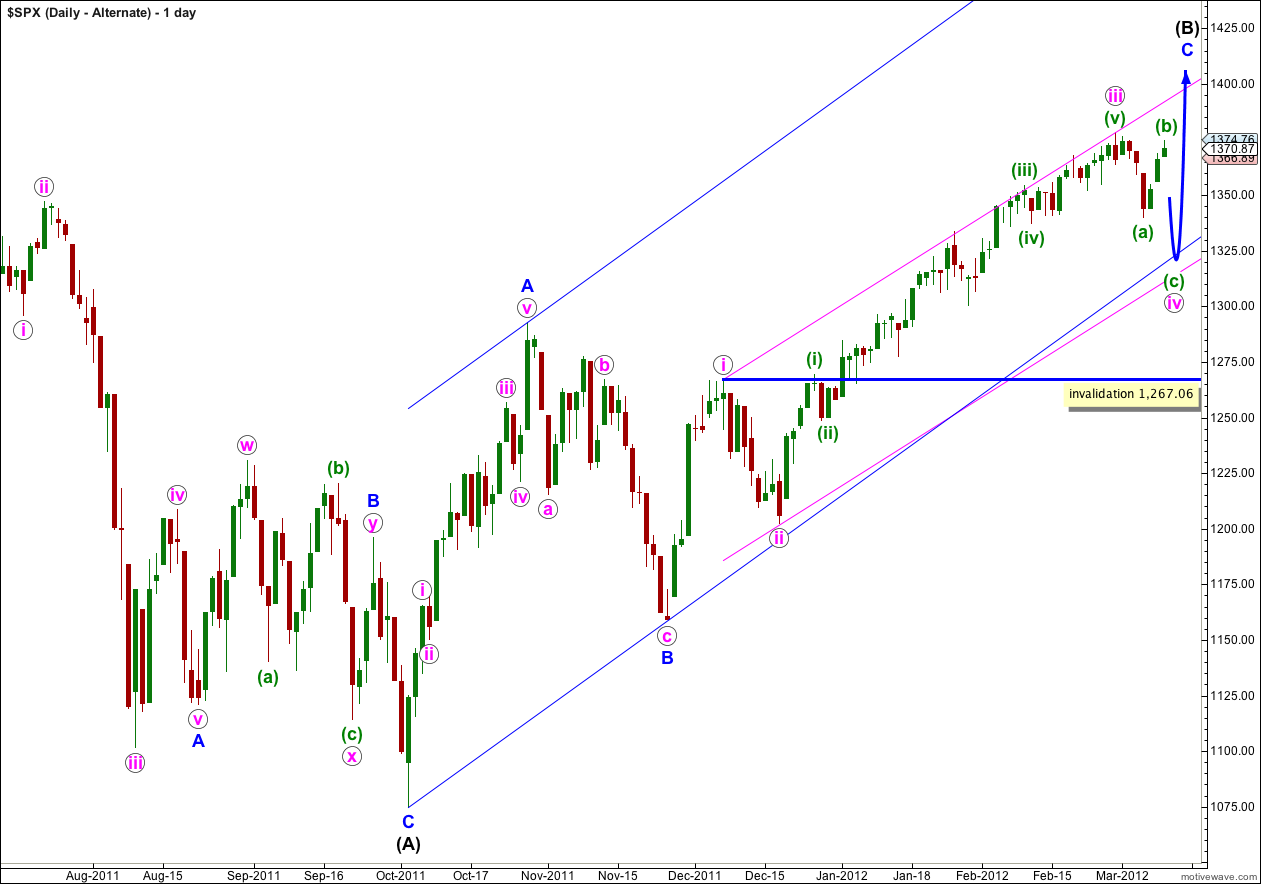
If this wave count is correct then wave iv pink is unfolding as a flat correction. A flat correction may have a B wave which makes a new price extreme beyond the start of its A wave. A new high above 1,378.04 would increase the probability that this wave count is correct.
A flat correction requires wave (b) green to be at least 90% the length of wave (a) green and this minimum requirement is now met.
If this wave count was correct I would expect wave (c) green downwards to find support about the lower blue and pink trend lines.
Wave iv pink may not move into wave i pink price territory. This wave count is invalidated with movement below 1,267.06.
This wave count has a lower probability than the main wave count because it sees wave (B) black as a single zigzag structure, which must see the upwards wave labeled here A blue as a five wave impulse, where the main wave count sees it as a three wave zigzag. This movement is a little ambiguous, but it fits much better as a three than a five.