
The S&P 500 moved higher, which is what we had expected again, but it has not met the minimum requirement that we expected.
With all this overlapping and lack of momentum I have discarded yesterday’s alternate wave count. This upwards movement just does not look like an impulse.
We have two hourly wave counts today looking at recent movement slightly differently. We may use confirmation and invalidation points to work with these two counts tomorrow.
The alternate daily wave count is looking increasingly unlikely. We will use it only to provide full and final confirmation of a big trend change, when it eventually arrives.
Click on the charts below to enlarge.
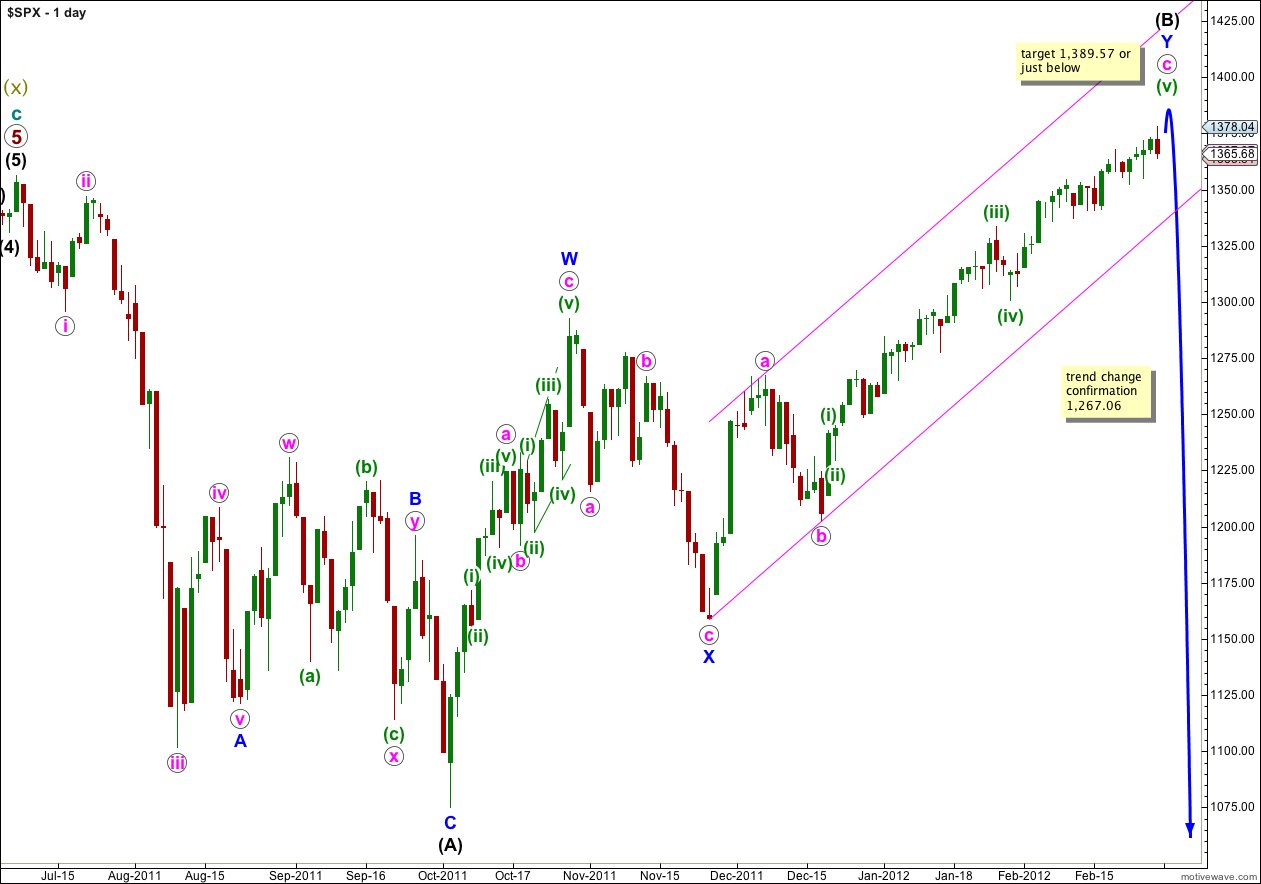
This main wave count follows on from our main historic monthly chart. It sees a flat correction at primary degree unfolding, and wave (B) black within that flat correction is probably within its last upwards wave and may end within the next couple of days, or it could continue longer.
Waves a and b pink within wave Y blue lasted a Fibonacci 8 days. Wave c pink is much longer, so far at 48 days. The next number in the Fibonacci sequence is 55, and wave c pink could possibly end on the 9th of March, 2012 (give or take one day either side of this date). Please be aware this is a rough guideline only. While Fibonacci price ratios are commonly seen, Fibonacci time relationships are less reliable.
Wave (B) black is here labeled as a double zigzag, which is a relatively common structure. When the second zigzag labeled wave Y blue is complete the probability that wave (B) black is complete will be very high indeed. The only way wave (B) black could continue further would be as a rare triple zigzag and the rarity of this structure means it has a very low probability.
Wave (B) black may move beyond the start of wave (A) black, and in fact for flat corrections this is most common. The maximum common length of B in relation to A within a flat is 138%. This would be achieved at 1,459. It is likely we shall see a trend change before this price point.
We may use Elliott’s channeling technique to draw a channel about wave Y blue. When this channel is breached by a full daily candlestick below it then we shall have strong confirmation of a trend change.
Wave (C) black is extremely likely to take price below the end of wave (A) black at 1,074.77.
Main Hourly Wave Count.
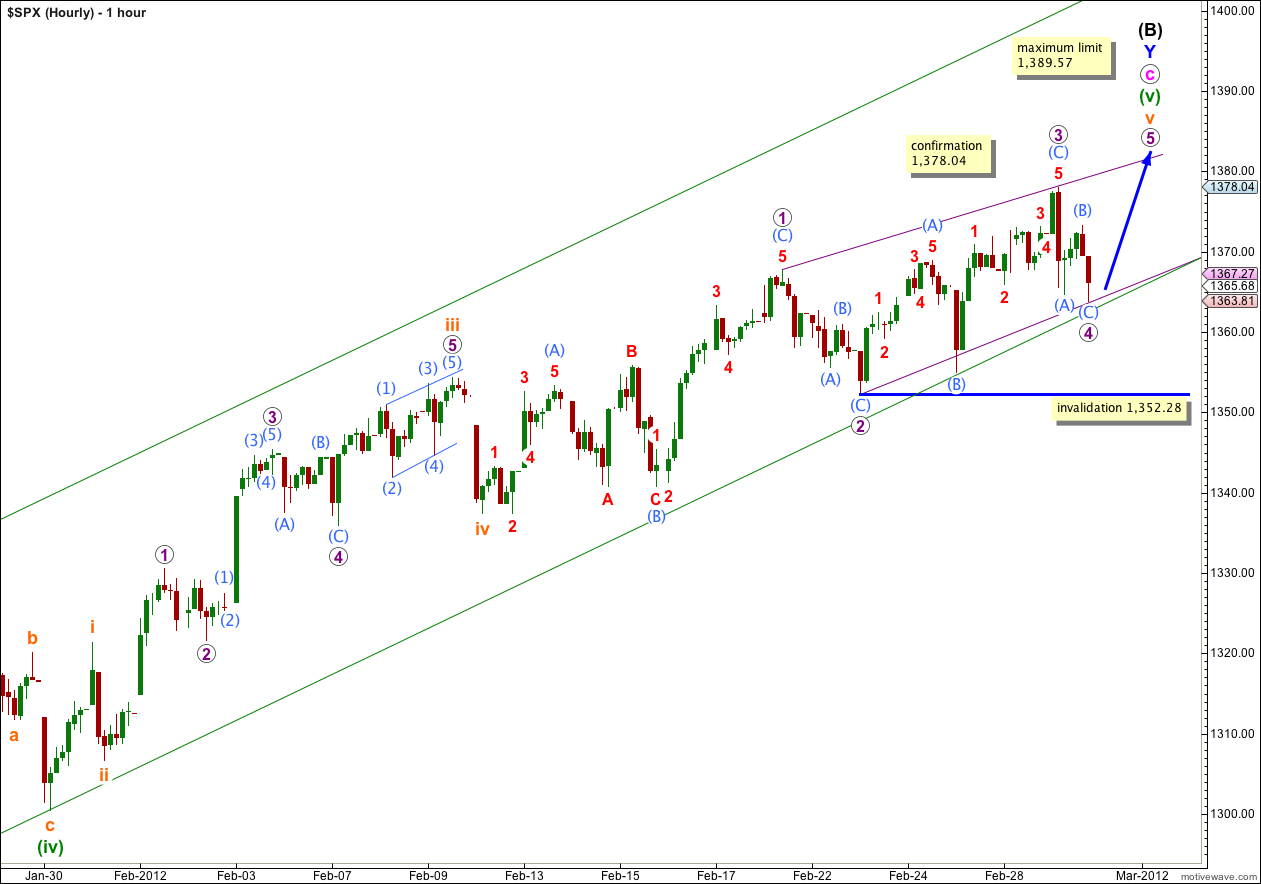
There are two ways to see an ending diagonal in wave v orange position: as an expanding or as a contracting diagonal. This wave count sees a contracting diagonal.
Wave 3 purple is shorter than wave 1 purple, and wave 4 purple is shorter than wave 2 purple. Wave 5 purple may not be longer than equality with wave 3 purple because third waves may never be the shortest. This gives a maximum limit to upwards movement for this wave count as no higher than 1,389.57.
Wave 5 purple must subdivide into a zigzag. There are not normally Fibonacci ratios between actionary waves within diagonals and I cannot use the length of 1 or 3 purple to calculate a target. When waves (A) and (B) aqua within wave 5 purple are complete I can use the ratio between waves (A) and (C) aqua to calculate a target.
Wave 4 purple has found support at the lower edge of the parallel channel. We should keep drawing this channel on hourly charts. The structure on the 5 minute chart for wave 4 purple is complete. It is most likely that tomorrow we shall see price move higher for wave 5 purple.
If wave 4 purple continues lower it may not move beyond the end of wave 2 purple. This wave count is invalidated with movement below 1,352.28.
Alternate Hourly Wave Count.
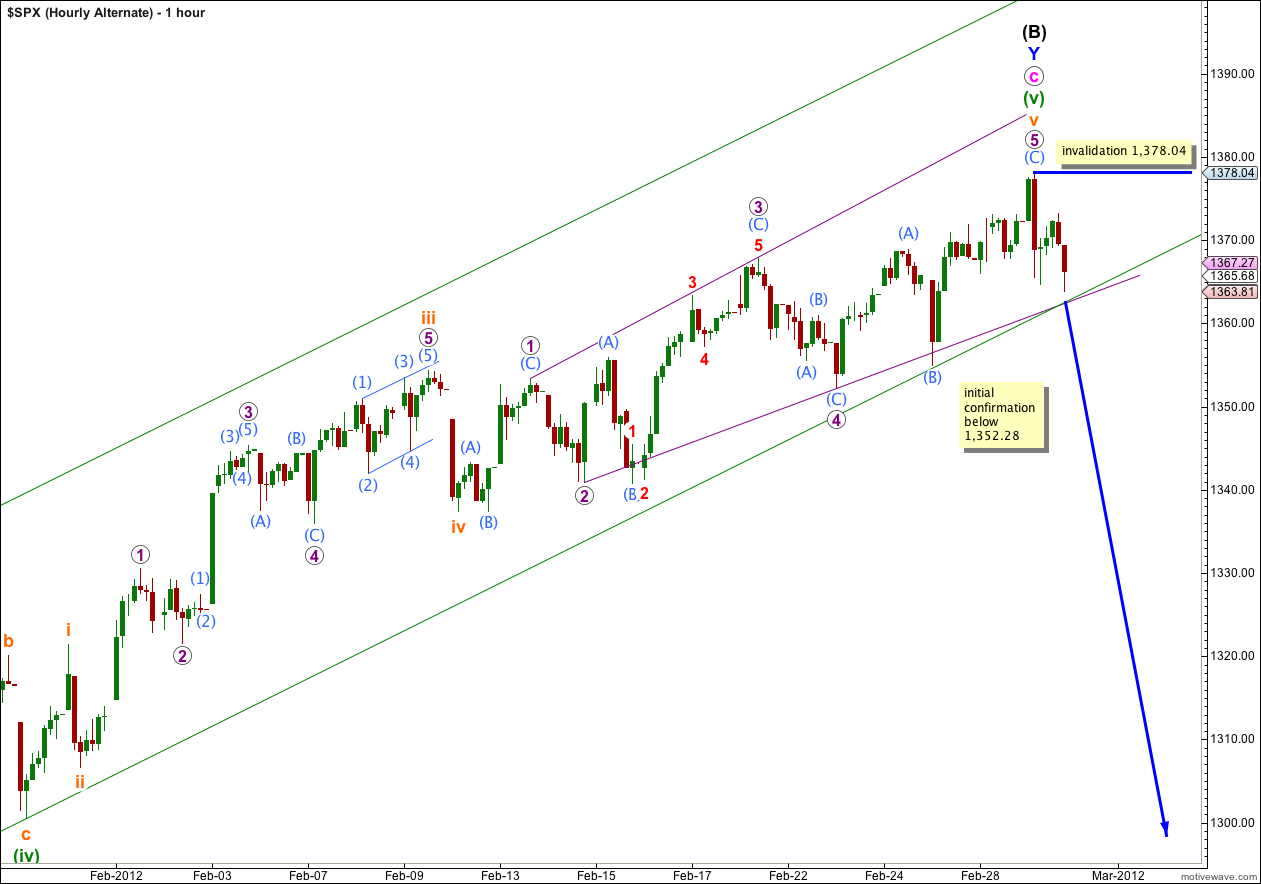
This was yesterday’s main wave count. It sees an ending expanding diagonal which would now probably be finished.
It is my alternate today because wave 5 purple failed to reach beyond equality with wave 3 purple. This gives this diagonal incorrect wave lengths, but I have many times seen diagonals where wave lengths are not exactly as expected and the third wave is still the longest. This is a tendency of third waves. However, the probability of this wave count being correct is significantly reduced today.
If the diagonal is expanding then it is probably over and again it is possible that we may have seen a big trend change during Wednesday’s session. Any movement above 1,378.04 would immediately invalidate this wave count.
Alternate Daily Wave Count.
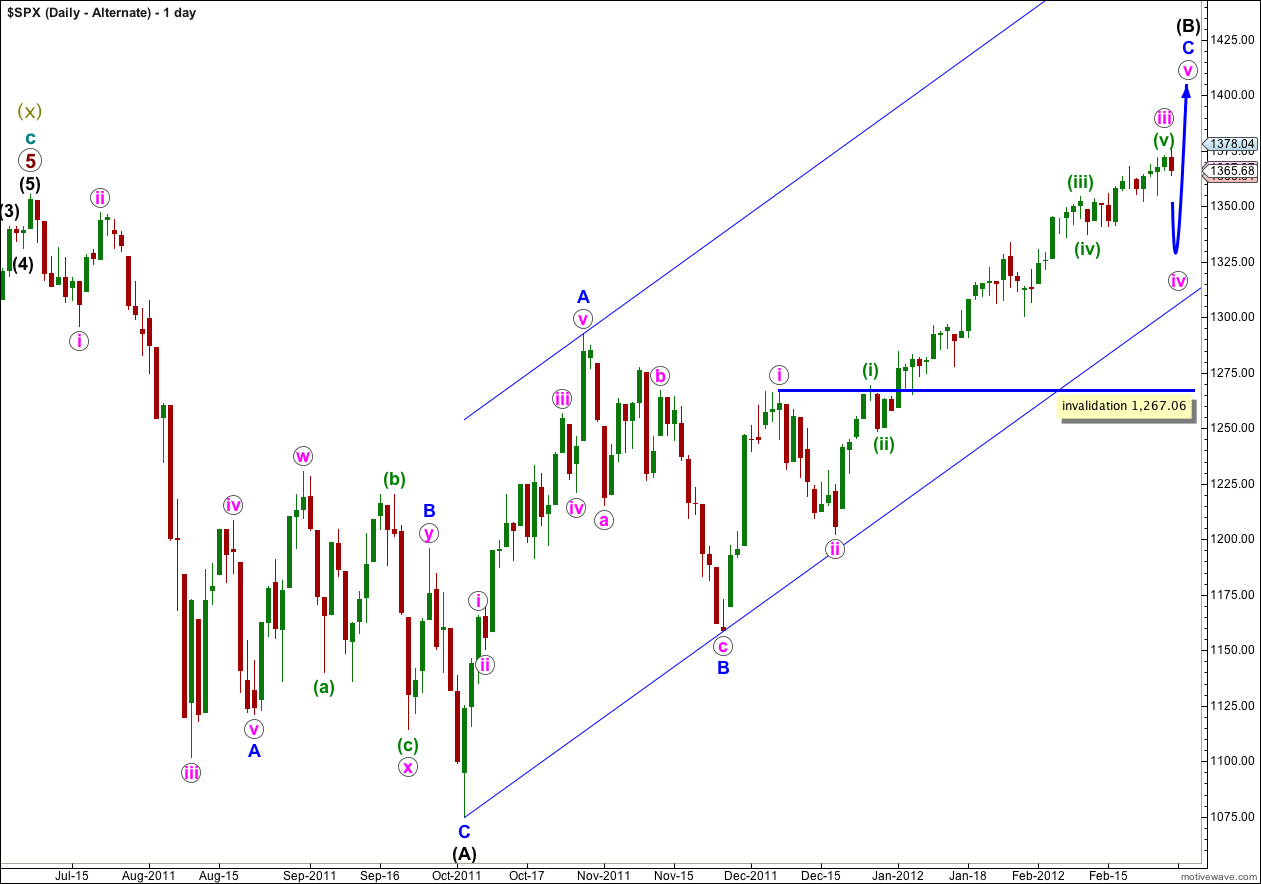
This alternate has a lower probability than the main daily chart. At this stage it is starting to look even more unlikely. If this wave count was correct I would have expected to see reasonable downwards movement for wave iv pink by now.
If the upwards wave labeled here A blue was a five, and not a three, then wave (B) black is a single zigzag. Wave C blue is incomplete.
The subdivision of wave A blue as a five is not nearly as satisfactory as seeing it as a three, which the main wave count does. This is the reason why this alternate has a much lower probability.
It looks increasingly like wave iii pink would be incomplete. When wave iv pink begins we would expect it to last one to two weeks and be a relatively shallow correction of wave iii pink. It should look about equal in duration to wave ii pink.
Wave iv pink may not move into wave i pink price territory and this wave count is invalidated with movement below 1,267.06.