
Last analysis expected the S&P 500 to be highly likely to reach to 1,367 (or very slightly above) and then turn downwards. This is exactly what happened during Tuesday’s session.
We have two hourly charts today and the only difference between them is the degree of labeling. We may use the invalidation point of one to confirm the other, i.e. when one is invalidated the other will be the only wave count. With this approach we can determine what degree of trend change we may be seeing.
Click on the charts below to enlarge.
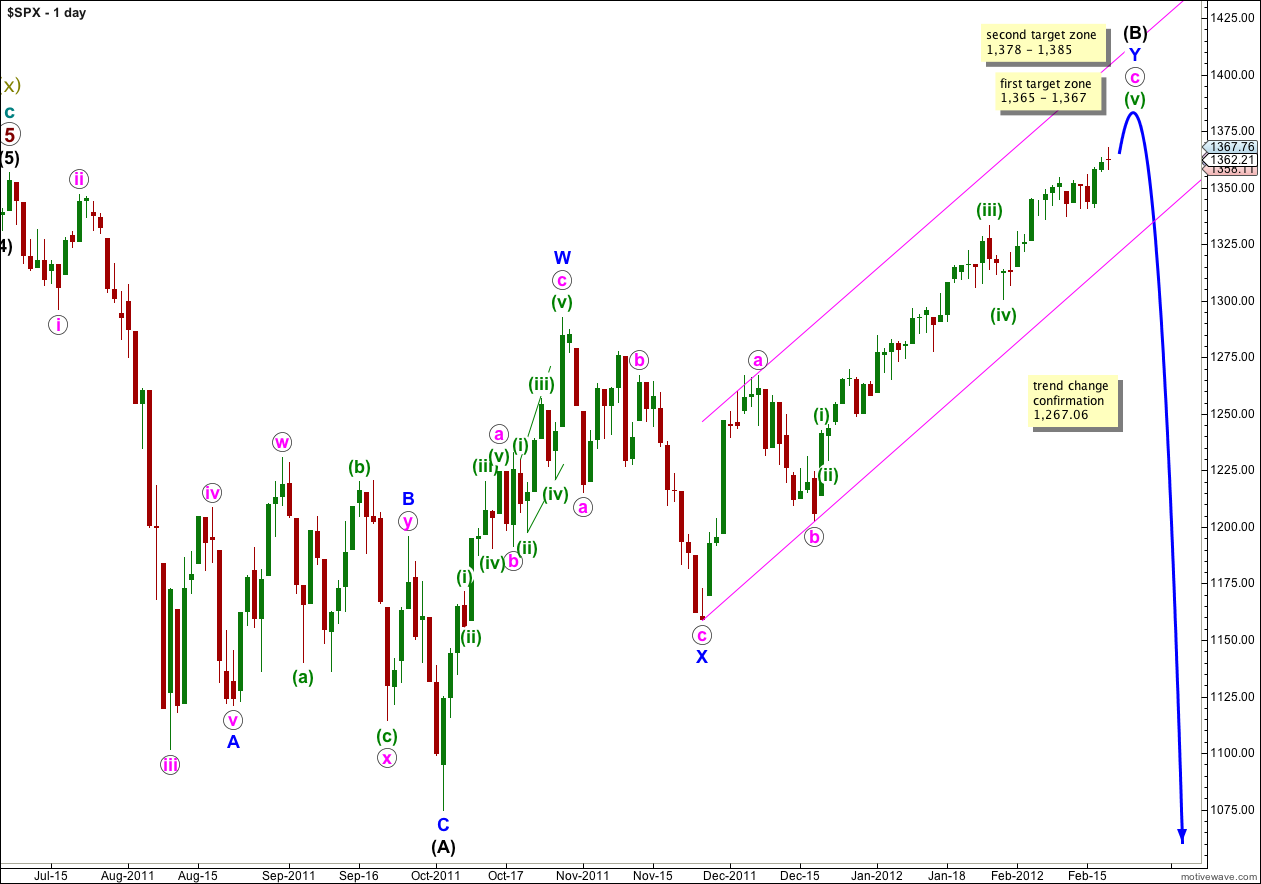
With price now reaching just above 1,367 there are some excellent Fibonacci ratios within this wave count. We are again faced with the possibility that wave (B) black may be complete at all wave degrees. However, we should always assume the trend remains the same until proved otherwise. We have absolutely no confirmation of a trend change at this stage, and if there has been a trend change this confirmation may be yet a few days away.
This main wave count has a higher probability than the alternate daily chart below because it sees wave W blue upwards as a three wave zigzag, which has a much better fit than trying to see it as a five wave impulse (the alternate idea).
Wave (B) black may move beyond the start of wave (A) black, and in fact for flat corrections this is most common. The maximum common length of B in relation to A within a flat is 138%. This would be achieved at 1,459. It is likely we shall see a trend change before this price point.
When wave (B) is complete then wave (C) must unfold in five waves down, as either an impulse or an ending diagonal. An impulse is the most likely and is easier to analyse. Wave (C) black does not have to make a new low below the end of wave (A) black, but it is extremely likely to do so.
There is unfortunately no clear Elliott wave rule regarding the length of wave (B) in relation to wave (A) for a flat correction. If price continues above 1,469 then this wave count would not be invalidated, but the probability would reduce significantly.
Movement below 1,267.06 would invalidate the alternate daily chart below and confirm this main wave count. At that stage we may have confidence that the S&P 500 has seen a trend change.
Movement below the parallel channel containing the zigzag for wave Y blue would also provide some indication of a trend change.
Main Hourly Wave Count.
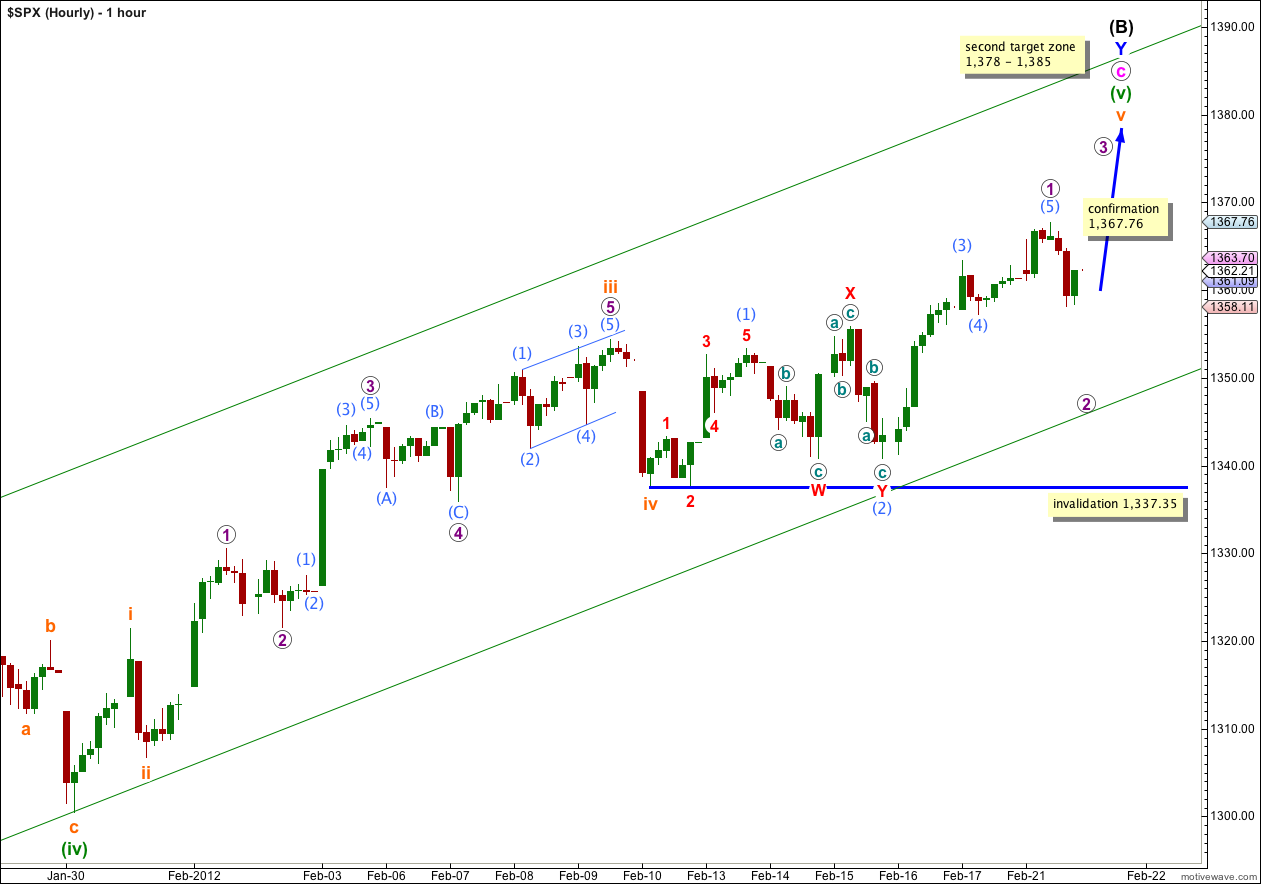
This is my main hourly wave count only because we should always assume that the trend remains the same, until proved otherwise.
Within wave v orange we have a complete five wave impulse. This may only be wave 1 purple within wave v orange. Wave 2 purple may move right down to the start of wave 1 purple at 1,337.35, but not below. Movement below this point would invalidate this wave count.
Ratios within wave 1 purple are: wave (3) aqua has no Fibonacci ratio to wave (1) aqua, and wave (5) aqua is just 0.63 points longer than 0.618 the length of wave (1) aqua.
I would expect wave 2 purple to find strong support at the lower edge of the parallel channel drawn here. We’ll keep drawing this channel on hourly charts as it should continue to be useful. Draw the first trend line from the lows of (ii) to (iv) green (I have labeled the low of (ii) green accurately on the daily chart) and then place a parallel copy upon the high labeled (iii) green. Wave (v) green may end within this parallel channel, either about the midline or possibly at the upper edge. When this channel is clearly breached by downwards movement then we shall have our first indication of a possible trend change.
This main hourly wave count expects further upwards movement. At 1,378 wave c pink would reach 1.618 the length of wave a pink. At 1,385 wave v orange would reach equality with wave iii orange. When more of wave v orange has unfolded I can use ratios within this to refine the target.
Alternate Hourly Wave Count.
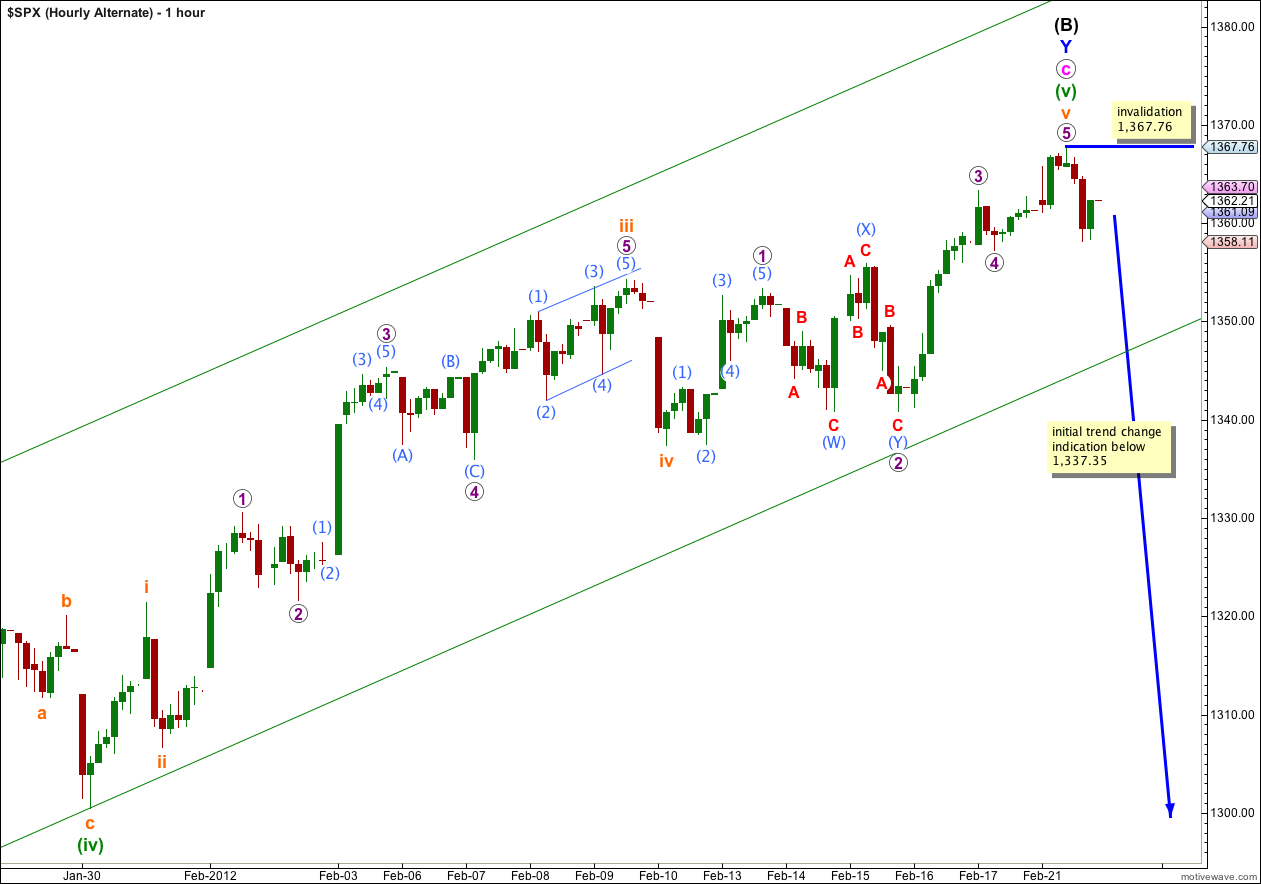
Alternatively it is possible that wave (B) black is complete at all wave degrees.
Initial indication that this wave count may be correct, that we have seen a trend change, would come with a breach of the parallel channel containing wave c pink.
Further indication would come with price movement below 1,337.35.
Further very strong indication would come with a breach of the wider parallel channel on the daily chart.
Final confirmation of a big trend change would come with price movement below 1,267.06. At that stage we would expect it is extremely likely for the S&P 500 to make new lows below 1,074.77.
If this wave count is correct then Fibonacci ratios are:
Wave c pink is just 10 points short of 1.618 the length of wave a pink. This is a 6% variation, less than 10% I consider acceptable.
Within wave c pink wave (iii) green is just 1.94 points short of 2.618 the length of wave (i) green, and wave (v) green is 3.02 points longer than 0.618 the length of wave (iii) green.
Within wave (v) green wave iii orange has no Fibonacci ratio to wave i orange, and wave v orange is just 0.97 points longer than 0.618 the length of wave iii orange.
Wave (B) black in its entirety is just over 105% of wave (A) black and the minimum length for an expanded flat, the most common type of flat, has been met.
Alternate Daily Wave Count.
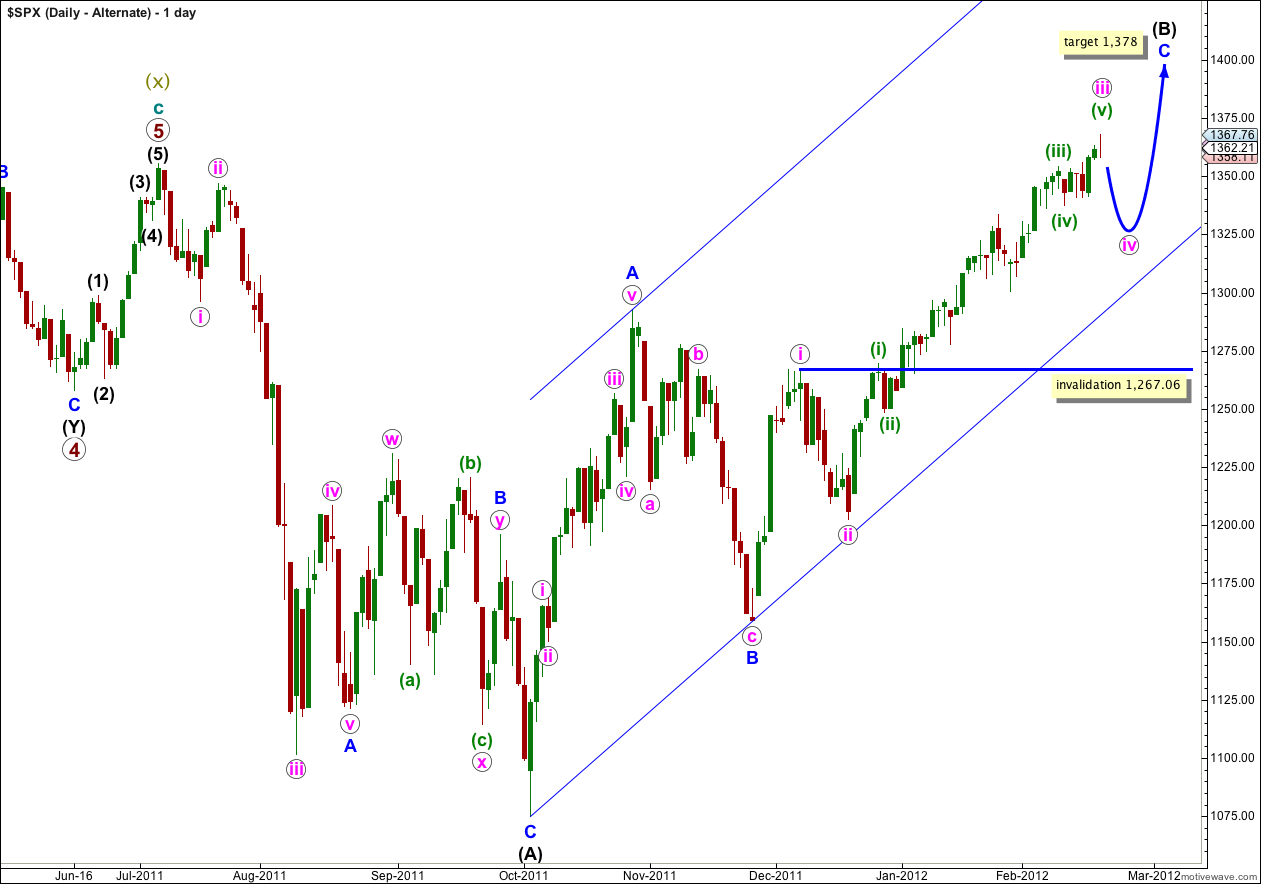
This alternate has a lower probability than the main daily chart.
If the upwards wave labeled here A blue was a five, and not a three, then wave (B) black is a single zigzag. Wave C blue is incomplete.
It looks increasingly like wave iii pink would be incomplete. When wave iv pink begins we would expect it to last one to two weeks and be a relatively shallow correction of wave iii pink.
Wave iv pink may not move into wave i pink price territory and this wave count is invalidated with movement below 1,267.06.