
Movement below our very short term invalidation point has indicated that an upwards impulse was complete. Price remains above the lower invalidation point on the hourly chart and we have no indication of a trend change.
We should always assume that the trend remains the same, until proved otherwise. The trend is your friend. At this stage we should expect price to reach our targets.
Click on the charts below to enlarge.
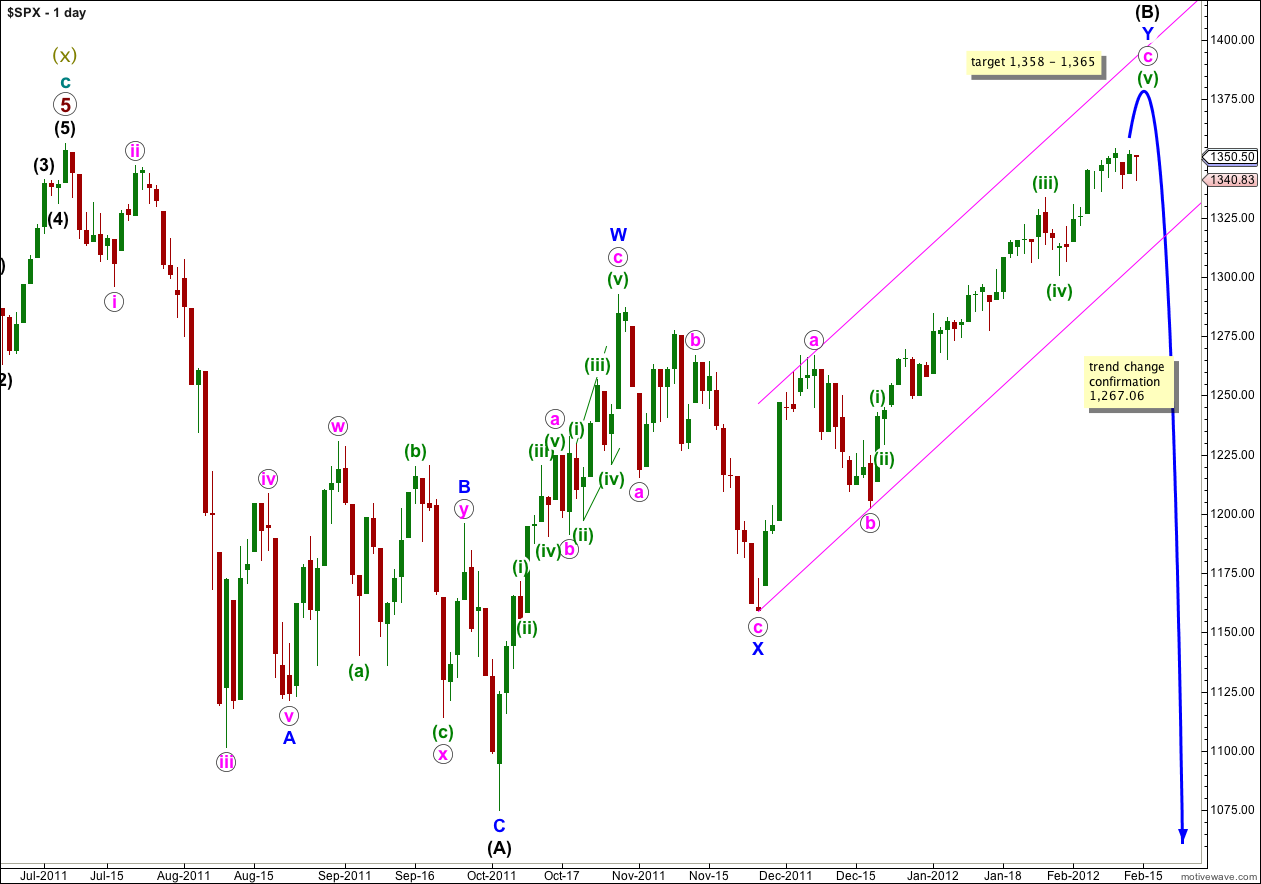
Price remains within the mid line of the parallel channel which has held since 20th December. We should assume new highs before this trend is over as the structure on the hourly chart still looks incomplete.
This main wave count has a higher probability than the alternate daily chart below because it sees wave W blue upwards as a three wave zigzag, which has a much better fit than trying to see it as a five wave impulse (the alternate idea).
Wave (B) black may move beyond the start of wave (A) black, and in fact for flat corrections this is most common. The maximum common length of B in relation to A within a flat is 138%. This would be achieved at 1,469. It is likely we shall see a trend change before this price point.
When wave (B) is complete then wave (C) must unfold in five waves down, as either an impulse or an ending diagonal. An impulse is the most likely and is easier to analyse. Wave (C) black does not have to make a new low below the end of wave (A) black, but it is extremely likely to do so.
There is unfortunately no clear Elliott wave rule regarding the length of wave (B) in relation to wave (A) for a flat correction. If price continues above 1,469 then this wave count would not be invalidated, but the probability would reduce significantly.
Movement below 1,267.06 would invalidate the alternate daily chart below and confirm this main wave count. At that stage we may have confidence that the S&P 500 has seen a trend change.
Movement below the parallel channel containing the zigzag for wave Y blue would also provide some indication of a trend change.
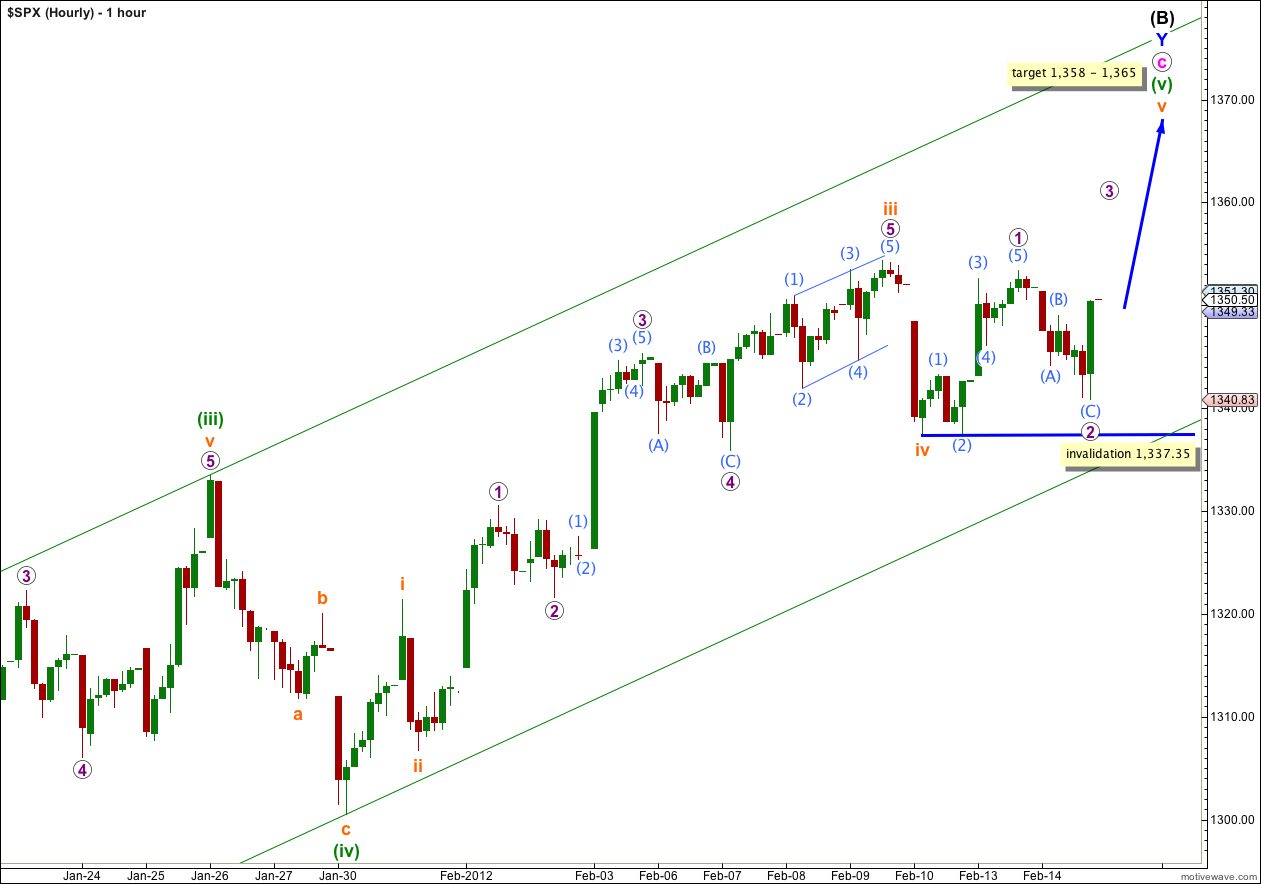
Movement below 1,343.27 invalidated the labeling of upwards movement for wave v orange. The upwards movement is most likely to be a complete impulse and because it did not make a new high beyond the end of iii orange at 1,354.32 it is most likely to be only wave 1 purple within wave v orange.
Wave 2 purple is a complete zigzag and a very deep correction.
Wave 3 purple has just begun at the end of Tuesday’s session.
If this analysis is correct then we should see the continuation of a third wave when markets open tomorrow.
Wave v orange is completing as an impulse. When it is a complete five wave structure then we will again be facing the possibility of a big trend change. Wave v orange is likely to take another week or so before it ends.
There is the very slim possibility that wave v orange is over and was truncated. If this wave count is invalidated with movement below 1,337.35 I will consider that possibility, or alternately that sideways movement is a continuation of wave iv orange correction. Both possibilities do not have the right look and would have a very low probability.
Any further continuation of wave 2 purple may not move beyond the start of wave 1 purple. This wave count is invalidated with movement below 1,337.35.
Alternate Daily Wave Count.
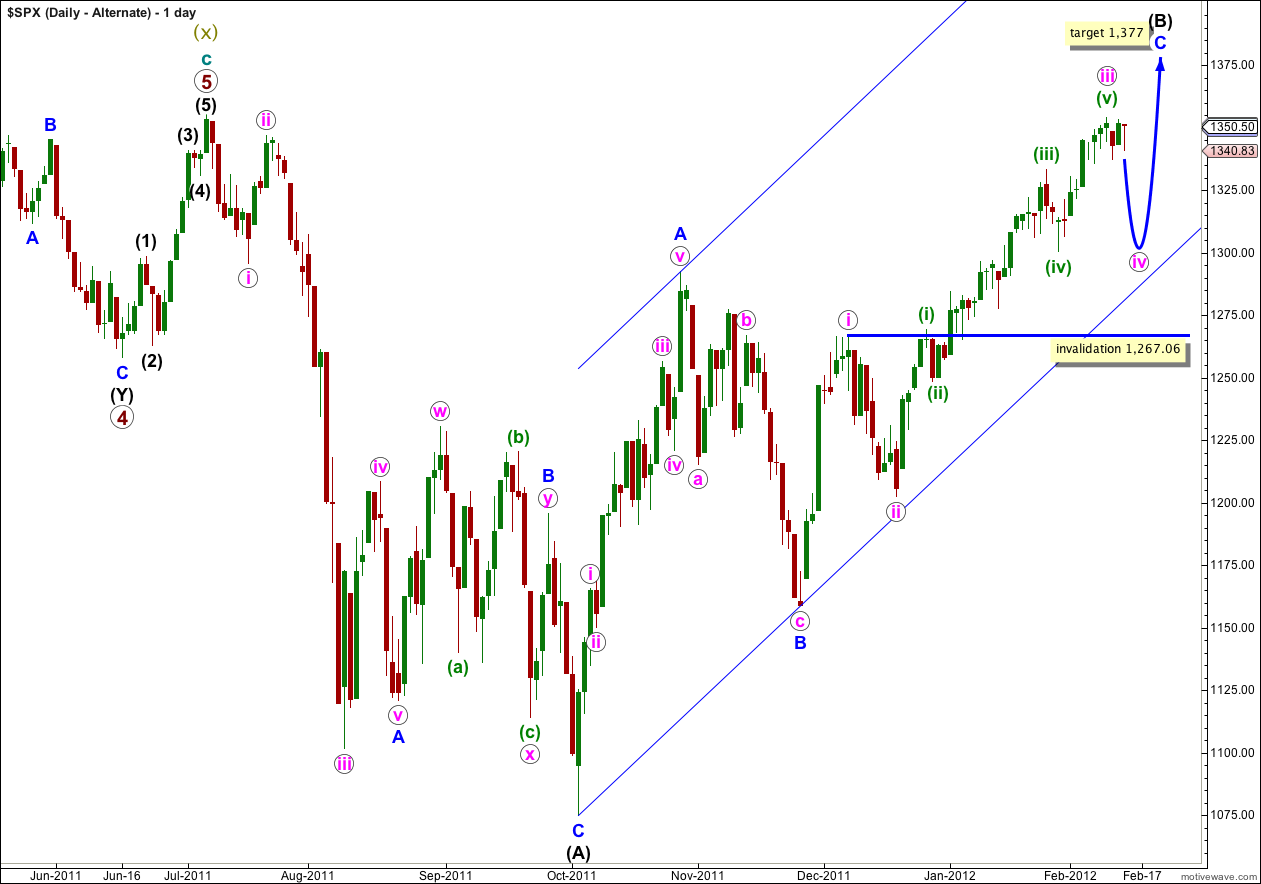
This alternate has a lower probability than the main daily chart.
If the upwards wave labeled here A blue was a five, and not a three, then wave (B) black is a single zigzag. Wave C blue is incomplete.
Wave iii pink is most likely now complete and wave iv pink has begun. Wave iv pink may last about one to two weeks. At this stage it looks like wave iv pink may move price mostly sideways as a flat correction, or a combination beginning with a flat.
Wave iv pink may not move into wave i pink price territory and this wave count is invalidated with movement below 1,267.06.