
Downwards movement during Friday’s session below 1,341.95 was unexpected and invalidated our hourly wave count. However, the structure remains incomplete. Our target is recalculated and we should expect it to be reached before we see a trend change.
Click on the charts below to enlarge.
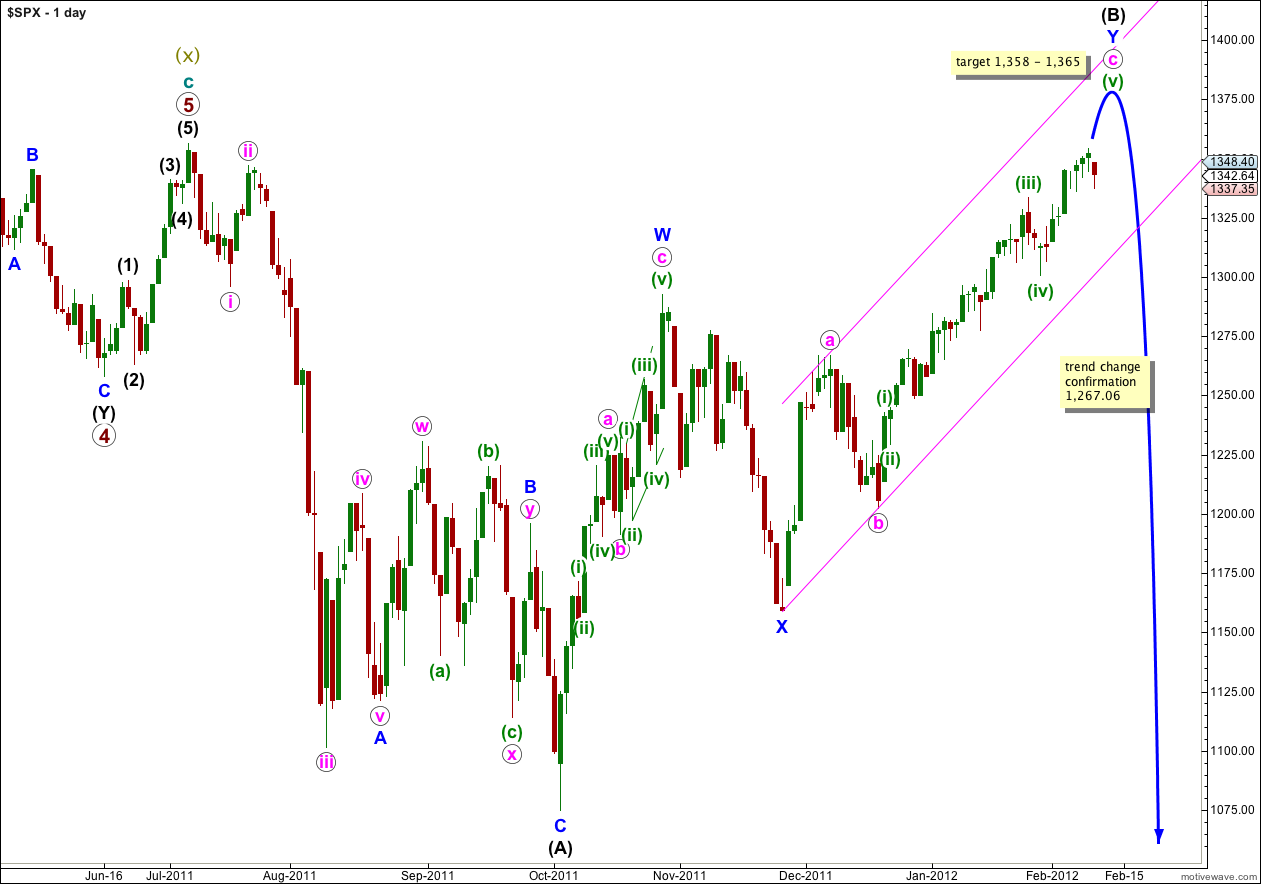
This main wave count has a higher probability than the alternate daily chart below because it sees wave W blue upwards as a three wave zigzag, which has a much better fit than trying to see it as a five wave impulse (the alternate idea).
Wave (B) black may move beyond the start of wave (A) black, and in fact for flat corrections this is most common. The maximum common length of B in relation to A within a flat is 138%. This would be achieved at 1,469. It is likely we shall see a trend change before this price point.
When wave (B) is complete then wave (C) must unfold in five waves down, as either an impulse or an ending diagonal. An impulse is the most likely and is easier to analyse. Wave (C) black does not have to make a new low below the end of wave (A) black, but it is extremely likely to do so.
There is unfortunately no clear Elliott wave rule regarding the length of wave (B) in relation to wave (A) for a flat correction. If price continues above 1,469 then this wave count would not be invalidated, but the probability would reduce significantly.
Movement below 1,267.06 would invalidate the alternate daily chart below and confirm this main wave count. At that stage we may have confidence that the S&P 500 has seen a trend change.
Movement below the parallel channel containing the zigzag for wave Y blue would also provide some indication of a trend change.
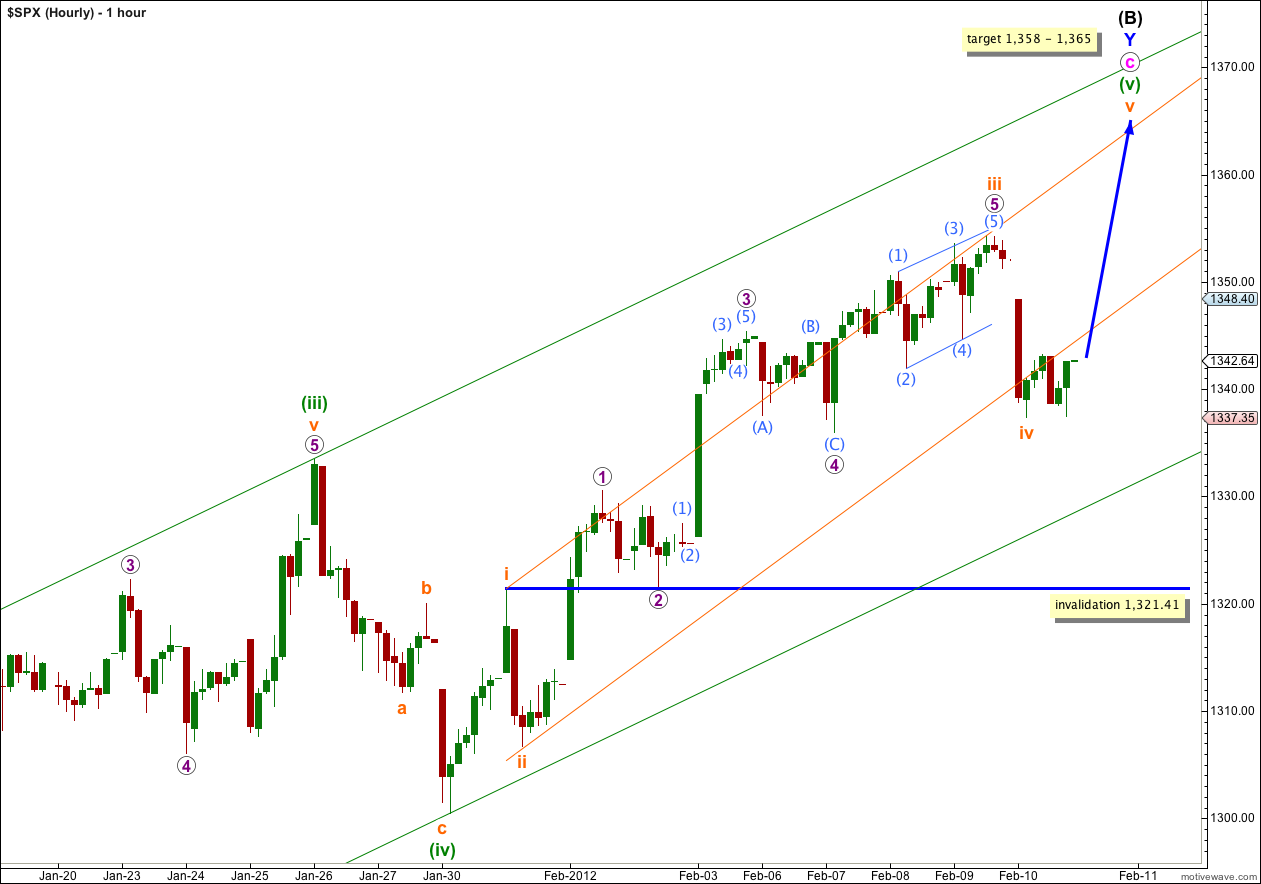
Movement below 1,341.95 invalidated how I had previously labeled wave (v) green. The ending diagonal which was unfolding was already complete, and it ended wave iii orange. With this labeling wave iii orange is now just 0.57 points longer than 2.618 the length of wave i orange.
On the 5 minute chart the sharp downwards wave labeled iv orange has a corrective count and it is a zigzag. This may be wave iv orange in its entirety, or it may only be wave A purple within wave iv orange. We must allow for the possibility that price may yet fall a little further and extend wave iv orange sideways and slightly lower. This is why the invalidation point must now be at 1,321.41 as wave iv orange may not move into wave i orange price territory.
I have redrawn the small parallel channel about wave (iv) green. The first trend line is drawn from the highs of i to iii orange, then a parallel copy is placed upon the low of ii orange. Wave iv orange has an overshoot, indicating a possible overshoot of wave v orange on the opposite side to come.
At 1,358 wave v orange (if it has begun at 1,337.35 and wave iv orange does not move any lower) would reach equality with wave i orange.
At 1,365 wave (v) green would reach 0.618 the length of wave (iii) green.
This gives us a 7 point target zone.
Alternate Daily Wave Count.
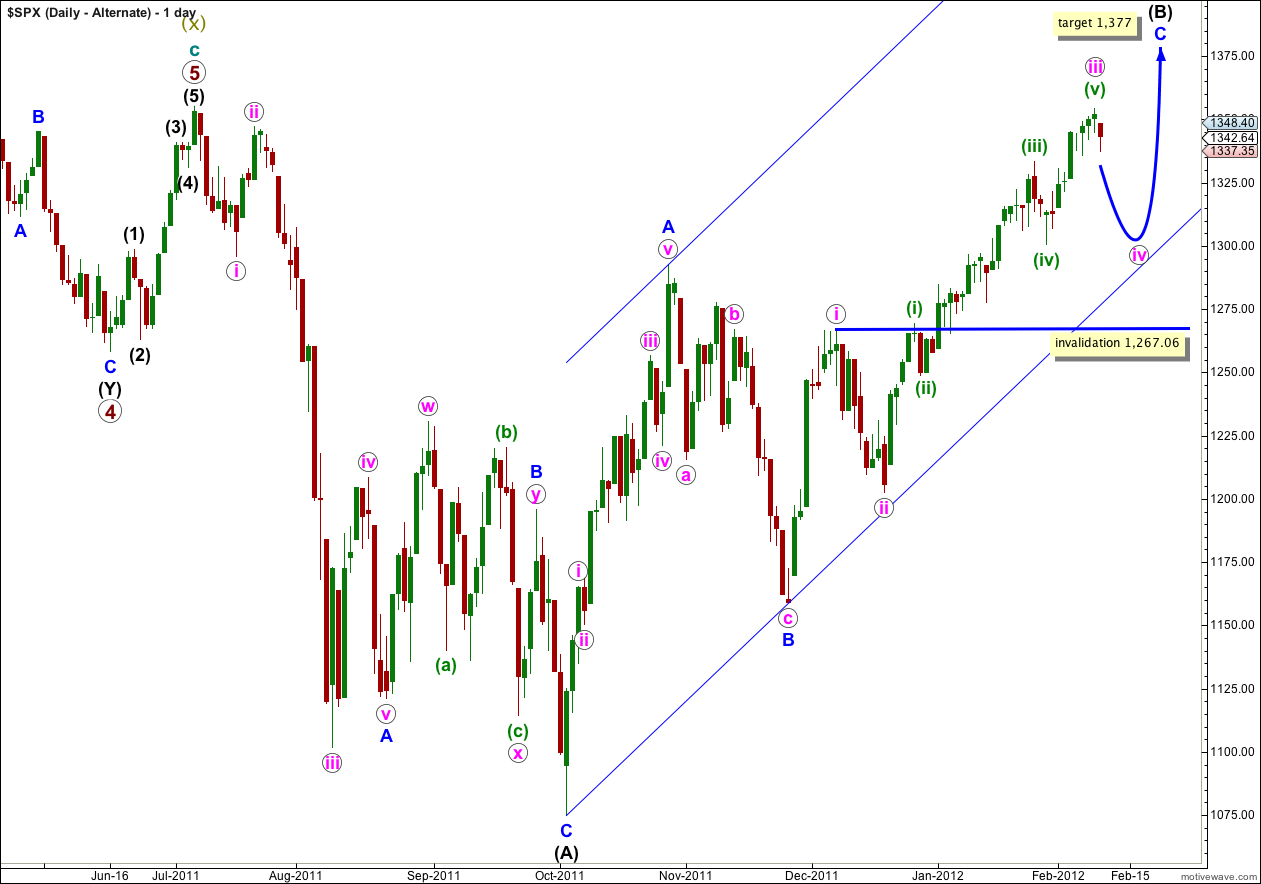
This alternate has a lower probability than the main daily chart, but we must consider it.
If the upwards wave labeled here A blue was a five, and not a three, then wave (B) black is a single zigzag. Wave C blue is incomplete.
Wave iii pink is most likely now complete and wave iv pink has begun. Wave iv pink may last about one to two weeks.
Wave iv pink may not move into wave i pink price territory and this wave count is invalidated with movement below 1,267.06.