
The main Dow wave count has been invalidated which means that the long term outlook has changed. We provide a new wave count today starting with a monthly chart.
Elliott Wave chart analysis for the DJIA for 8th February, 2012. Please click on the charts below to enlarge.

This monthly wave count sees the Dow within a double combination correction at dark yellow degree.
Waves (w) and (x) dark yellow are complete. The second structure labeled (y) dark yellow is therefore in progress.
Within wave (y) dark yellow we expect wave (A) black within wave A maroon of wave a teal green is complete and that more upwards movement is expected within wave (B) black.
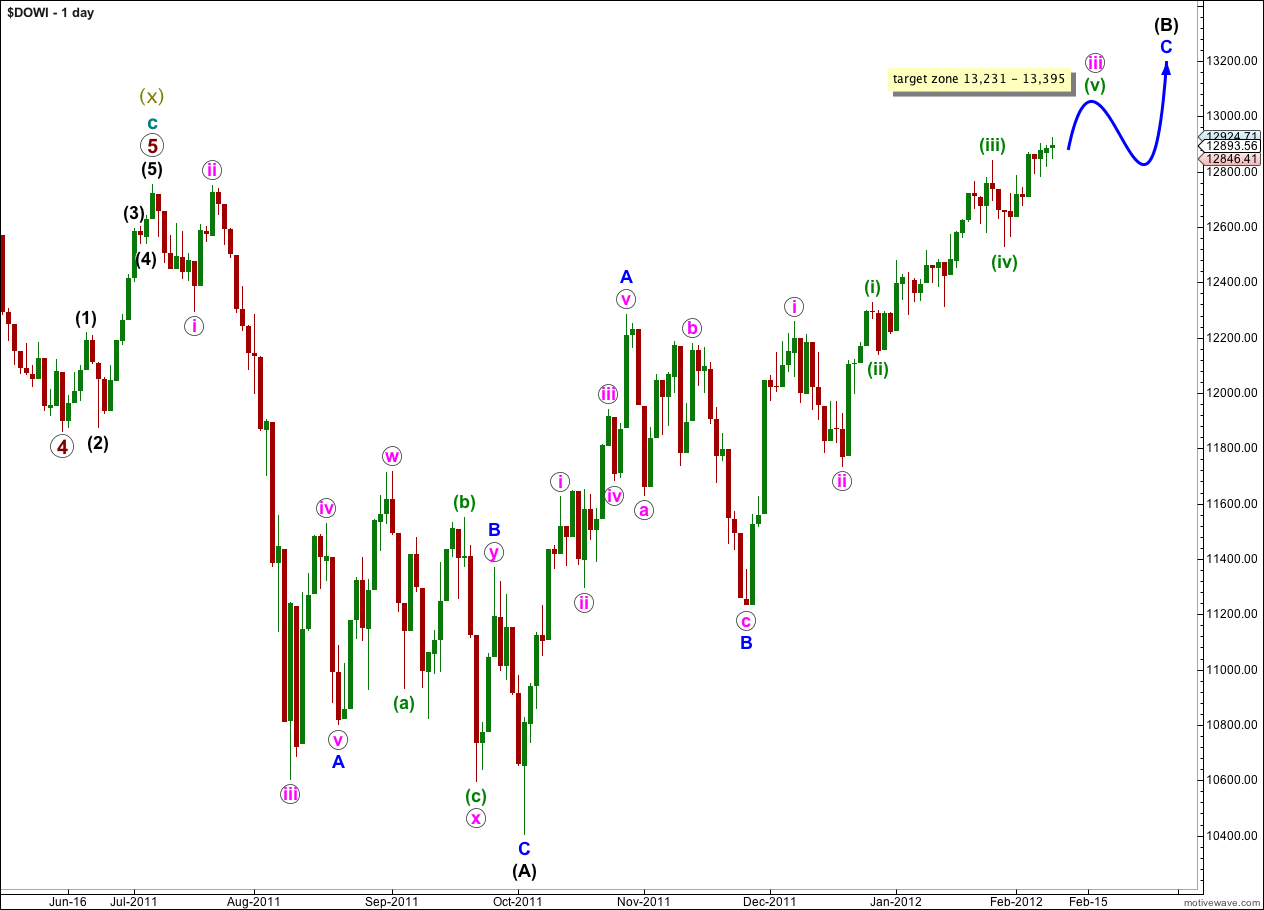
This daily wave count looks at the structure within wave (B) black.
Within wave (A) black, ratios within wave A blue are: wave iii pink has no adequate Fibonacci ratio to wave i pink and wave v pink is 12.23 points shorter than 1.618 the length of wave i pink.
Within the zigzag of wave (B) black waves A and B blue are complete and a five wave impulse is expected for wave C blue. Within wave C blue waves i and ii pink are complete with wave iii pink subdividing into green degree with waves (i) through (iv) green likely complete.
Within wave (B) black, there is no adequate Fibonacci ratio for wave (iii) green with wave (i) green within wave iii pink of wave C blue. This makes it more likely that we may see a Fibonacci ratio for wave (v) green with either of waves (i) or (iii) green.
Upwards movement is expected to complete wave iii pink before a larger correction for wave iv pink which is likely to see price move sideways, before the final impulse to complete wave C blue and wave (B) black.
At 13,231.19 wave (v) green would reach equality with wave (iii) green and at 13,395.44 wave iii pink would reach 1.618 the length of wave i pink. This provides us with a high probability target zone where we may see wave iii pink complete.
Movement below 12,257.67 would invalidate this wave count as wave iv pink may not move into the price territory of wave i pink.

This hourly wave count looks at the structure within wave (v) green of wave iii pink.
Wave (v) green is seen as subdividing into a series of first and second waves at orange, purple and aqua degree. To increase the confidence in this wave count we would need to see an increase in upwards momentum as the Dow is seen within a number of third waves.
The series of first and second waves do increase the likelihood of the target zone as much of the structure within wave (v) green is still incomplete.
Movement below 12,676.09 would invalidate this wave count as wave (2) aqua may not move beyond the start of wave (1) aqua.
Alternate Hourly Wave Count

This alternate hourly wave count is the same as the main above except that it sees wave (iv) green as incomplete and would allow further downwards movement.
There is no invalidation to the upside as wave b orange within wave (iv) green may extend higher.
Movement below 12,328.32 would invalidate this wave count as wave (iv) green may not move into the price territory of wave (i) green.