
Sideways movement in a small range for Monday’s session has not provided clarity. Price is very close to an important invalidation point. However, if price moves above this point I am comfortable that I have a wave count which fits all subdivisions.
If we switch to using the alternate wave count (if the main is invalidated) it means that outlook for the next 10 years is significantly different. This is an important and crucial time for the S&P 500.
Click on the charts below to enlarge.
I have been considering the implications of the alternate wave count published here over the weekend.
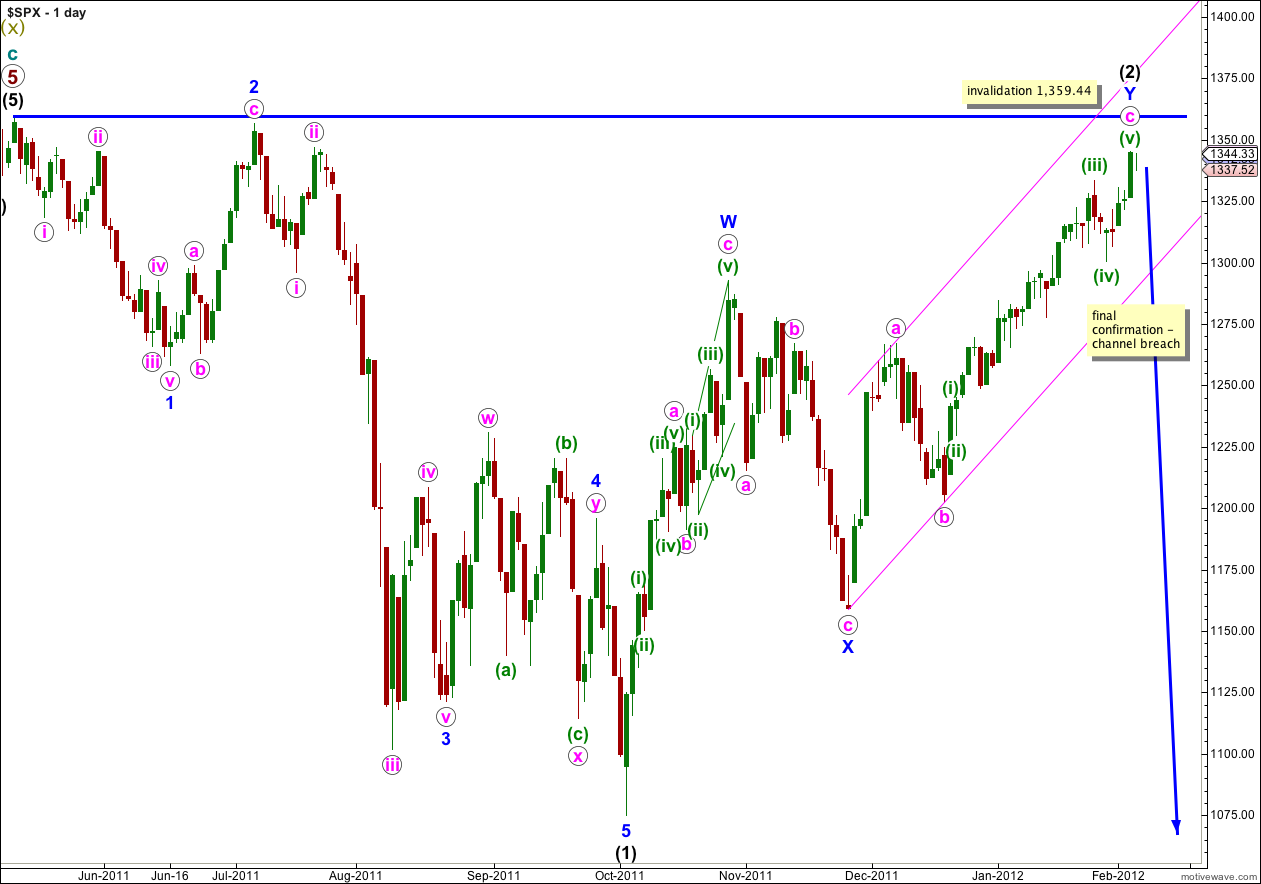
If this main wave count above is invalidated by movement above 1,359.44 then we will be using the alternate historic wave count. The outlook for the next 10 years will change from a reasonably bearish outlook, to a less bearish one.
The purpose of double flats and double combinations is to take up time and move price sideways. If the second structure in the double begins with a flat for primary wave A, then we are looking at a flat unfolding at cycle degree for a also. This means that unlike a zigzag clearly trending downwards, the next couple of years will have strong downwards movement followed by another “recovery” as a B wave must move price back upwards to at least 90% of the A wave downwards. The outlook changes from a more clearly bearish position to one where we expect a series of “crashes” followed by deep “recoveries” which may even make new price highs. A series of violent swings, overall taking up about 10 years (the first structure in the double lasted 9 years and this second structure may be expected to be about the same), is what can be expected.
I am aware that the Nasdaq has made a new high. However, on a monthly chart the Nasdaq and S&P 500 wave counts look very different. They are separate markets and I will approach analysis of the S&P 500 from a pure Elliott wave perspective which states each market is separate and does not influence the other. And although the Dow and S&P 500 look extremely similar on a monthly chart and their wave counts are very similar, and for these reasons I’m considering that what happens with one is likely to happen with the other, they are both separate markets.
This main wave count sees a recent trend change at super cycle degree at (x) olive green, and the start of a new corrective structure here. Within (y) olive green cycle wave a is most likely to be a zigzag or five wave structure, which should strongly trend downwards. At this stage only primary wave A (or primary wave 1) is unfolding and this wave count sees it as a five wave structure. Thus within primary wave A waves (1) and (2) black are complete. Wave (3) black downwards should have begun, or be extremely close to it.
Only when we have trend channel confirmation on the daily chart can we be confident of this wave count. If this wave count is correct then channel confirmation may be up to a week or two away at this stage.
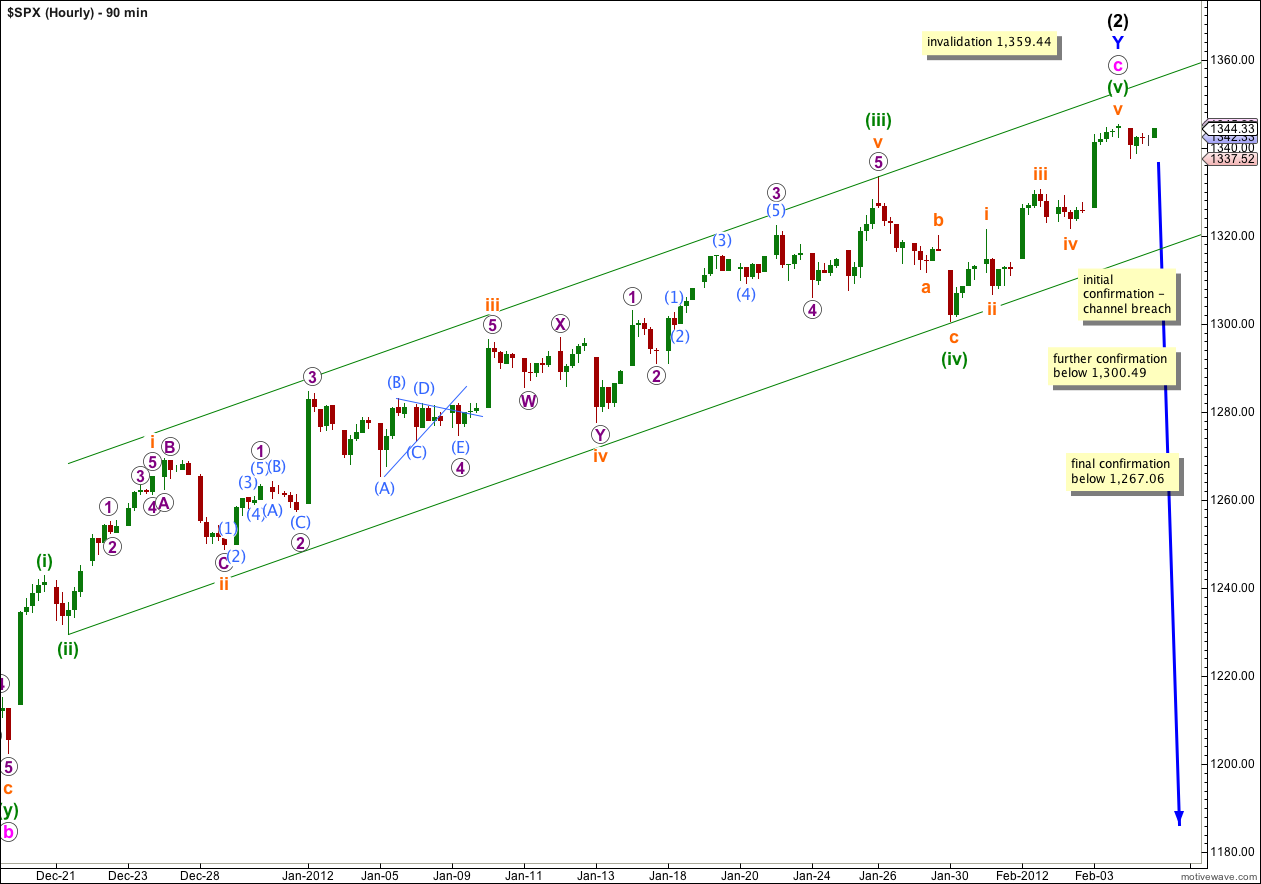
If this wave count is correct then our first indication may come with a channel breach on the hourly chart.
The structure of Monday’s movement on the 5 minute chart is not enough at this stage to clarify whether or not there has been a trend change.
I cannot rule out a very slight new high at this stage. Wave iii orange within (v) green may not be over, it could be extending. The Dow has 6.06 points in which to move and the S&P 500 14.1 points, and a very small amount of upwards movement could occur. This is why I’m leaving the invalidation point at 1,359.44.
When price moves below 1,300.49 then wave (v) green must be over, and so we have seen at least a short term trend change.
Movement below 1,267.06 would be strong indication of a trend change as at that point downwards movement may not be a fourth wave correction within a final C wave upwards, and the upwards movement would have to be over.