
Movement above 1,333.47 was reasonably unexpected and has invalidated our wave count, although we did have some indication before yesterday’s session that this could happen.
The Dow importantly has reached to within 6.09 points of its invalidation point on the daily chart. If this wave count (which is the same for the Dow and S&P 500) is correct then this should be the end of upwards movement.
However, I have continued to look for alternates and I have found an alternate with which I am much more comfortable than my previous second historic alternate, and which allows for some movement to a new high for both the S&P 500 and the Dow. I present this first to you.
Click on the charts below to enlarge.
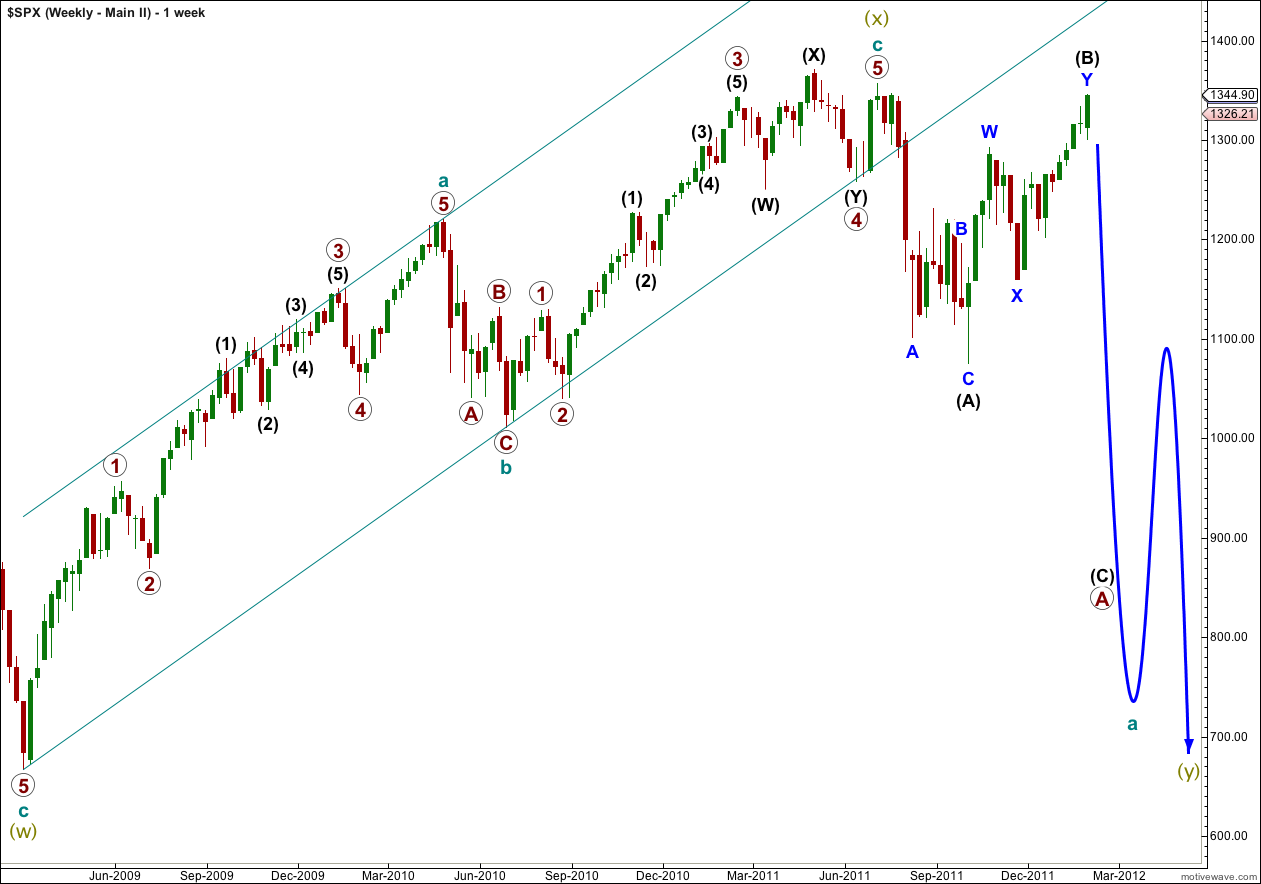
This weekly chart follows on from the main monthly wave count which is found in the historic analysis.
If super cycle wave (x) ended at 1,356.48 on 3rd July, 2011, then the following downwards movement is in a three wave structure. This is highly significant.
Super cycle wave (y) may be a flat, zigzag or triangle. It is most likely to be a flat or zigzag. If it is a flat then cycle a (teal green) must subdivide into a three, not a five.
If cycle a subdivides into a three then it may be either a flat or zigzag. If it is a flat then primary wave A within it must subdivide into a three.
Primary wave A as a three may be either a zigzag or a flat. If it is a flat then black wave (A) must subdivide into a three, which fits with this wave count.
When wave (A) black subdivides into a three that means wave (B) black may make a new price extreme beyond the start of (A) which is at 1,356.48. In fact, the most common type of flat is an expanded flat which would require wave (B) black to end at or above 1,370.57.
If price moves above 1,359.44 then this will be the wave count I will use. The subdivisions fit much better than my previous attempt to find an alternate last week, and it has a higher probability. It still sees the upwards wave labeled super cycle (x) as a three wave structure which is what it looks like most easily on weekly and monthly charts, and it is nicely contained within its trend channel drawn using Elliott’s technique.
This alternate has the same mid to long term bearish outlook as our main wave count. It is just the structure of super cycle wave (y) which differs between the two. This alternate, and our main wave counts, are not as bearish as Prechter’s wave count which I have as an alternate in the historic analysis.
However, the probability of this alternate is still lower than the main weekly and monthly charts. This is because cycle wave a as a three wave structure would be more likely to be a zigzag than a flat, and we would be expecting a five down for primary wave A, and not a three.
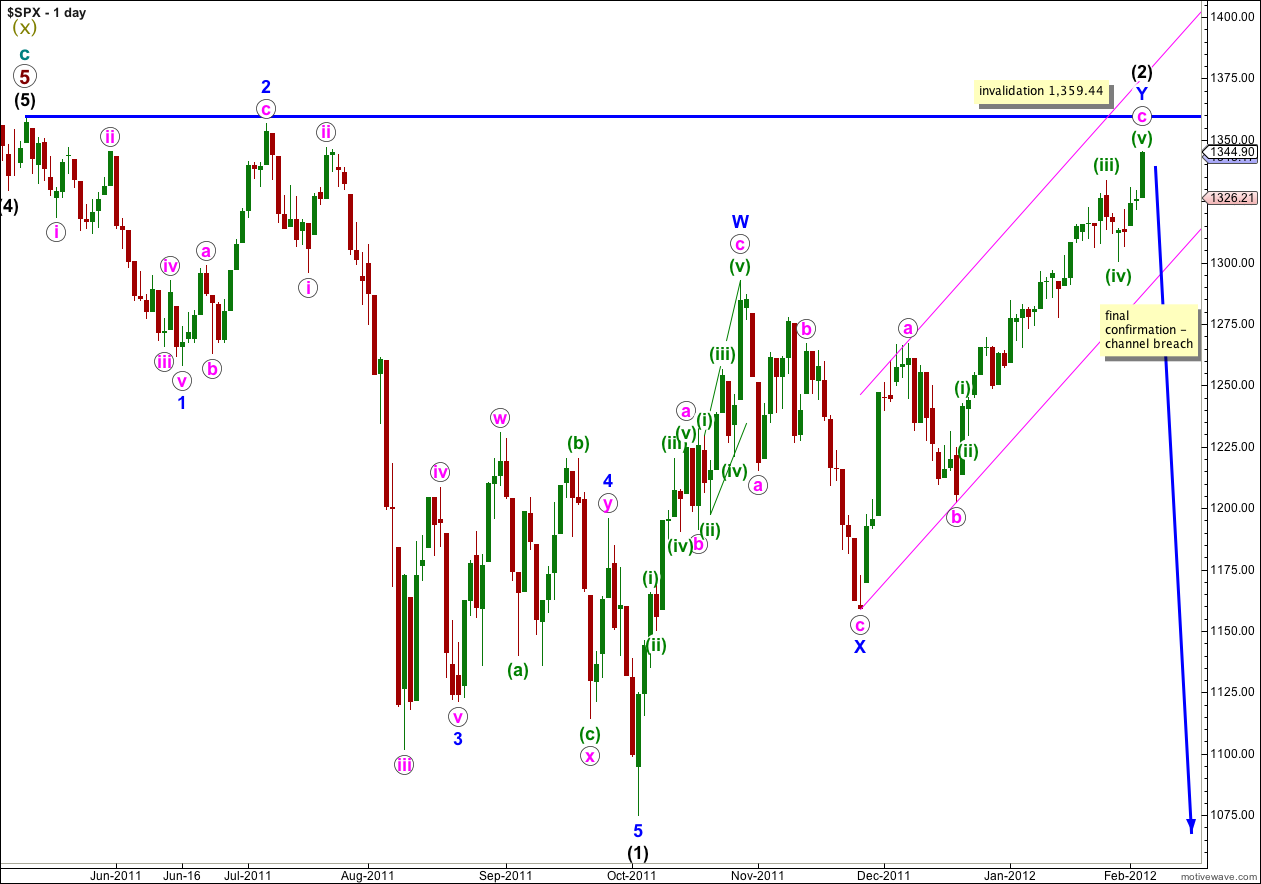
This main wave count follows on from the main monthly and weekly wave counts found in the historic analysis (not the alternate weekly chart above).
We must move the invalidation point back to the start of wave (1) black now that wave (2) black has continued higher.
Wave c pink still has no Fibonacci ratio to wave a pink, although it is very close to 1.382 the length of wave a pink (not correctly a Fibonacci ratio).
Ratios within wave c pink are: wave (iii) green is just 1.94 points short of 2.618 the length of wave (i) green, and wave (v) green if it is over at the end of Friday’s session is 4.4 points longer than equality with wave (i) green. These ratios are very typical.
Again the structure within wave c pink may be considered complete. With the Dow having only 6.06 points room for any more upwards movement this structure now must be complete, if this wave count is correct.
We need to wait for final confirmation of wave Y blue being complete with a full daily candlestick below the pink parallel channel on this daily chart to have confidence in this very big trend change. Until we have that final confirmation we must admit the possibility that this wave count could be invalidated by upwards movement, although I consider that scenario still has a low probability.
Wave (2) black may not move beyond the start of wave (1) black. This wave count is invalidated with movement above 1,359.44.
If this wave count is invalidated by upwards movement above 1,359.44 then expect price to continue higher to 1,370.57 or above.
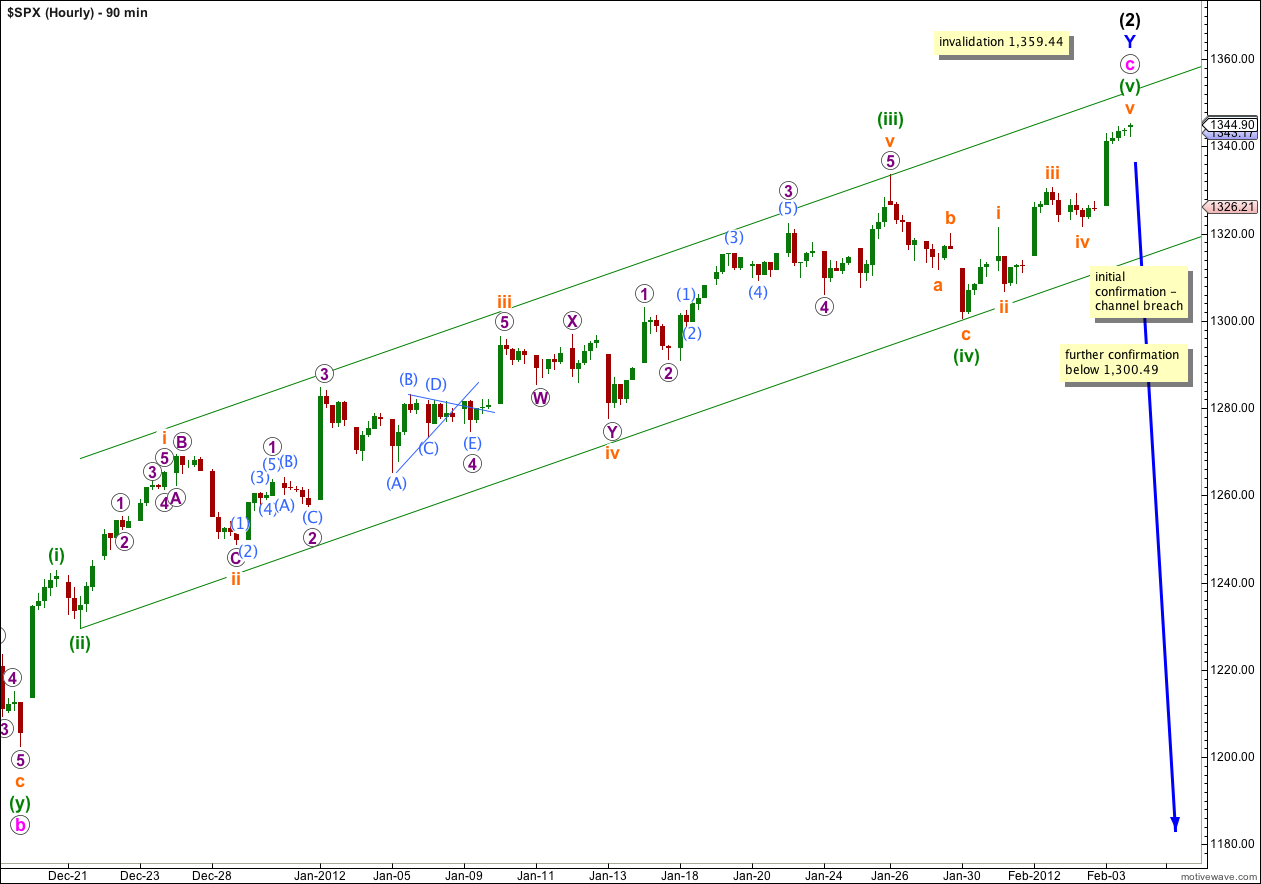
The chart above is a 90 minute chart so that we may see the entirety of wave c pink.
Ratios within wave (iii) green are: wave iii orange has no Fibonacci ratio to wave i orange,
Ratios within wave (iii) green of wave c pink are: wave iii orange has no Fibonacci ratio to wave i orange, and wave v orange is 2.24 points short of 1.618 the length of wave i orange.
Ratios within wave (v) green are: wave iii orange has no Fibonacci ratio to wave i orange, and wave v orange is just 0.06 points short of equality with wave iii orange.
I have redrawn the parallel channel with the reanalysis of this upwards wave. The first trend line is drawn from the lows of (ii) to (iv) green, then a parallel copy is placed upon the high of wave (iii) green.
It is possible that we may see a very small amount of further upwards movement during Monday’s session for price to touch the upper edge of this parallel channel.
When we see price movement below this channel on the hourly chart then we shall have our very first indication that we may have seen a trend change.
With price movement below 1,300.49 wave (v) green would have to be over, because no second wave correction within it may move beyond the start of its first wave. That also would provide indication of a trend change.
Final confirmation will come with a channel breach on the daily chart.
Second waves may correct right up to the start of first waves and this is how double tops and double bottoms are created. When they do this it tends to be a very tense experience with the correction convincing everyone that a new price extreme will be seen and a new trend is here to stay, right before a third wave moves price in the opposite direction.
At this critical juncture I advise extreme caution with this market. Hopefully, next week we shall see better confirmation of a trend change, although we should not necessarily expect the start of wave (3) black downwards to exhibit strong downwards momentum.
If price moves above 1,359.44 next week then we shall have clarity as to the structure we should expect next. The outlook is still bearish in the mid to long term.