The S&P 500 behaved as expected during Wednesday’s session, moving higher to 2.52 points above our short term target before turning back down again.
At this very early stage we have some confirmation on the hourly chart that we may recently have seen a major trend change from the S&P 500. When we have a trend channel breach on the daily chart of the parallel channel drawn using Elliott’s technique, then I will have much more confidence in this wave count. We may get this final confirmation next week, or possibly the week after.
Click on the charts below to enlarge.
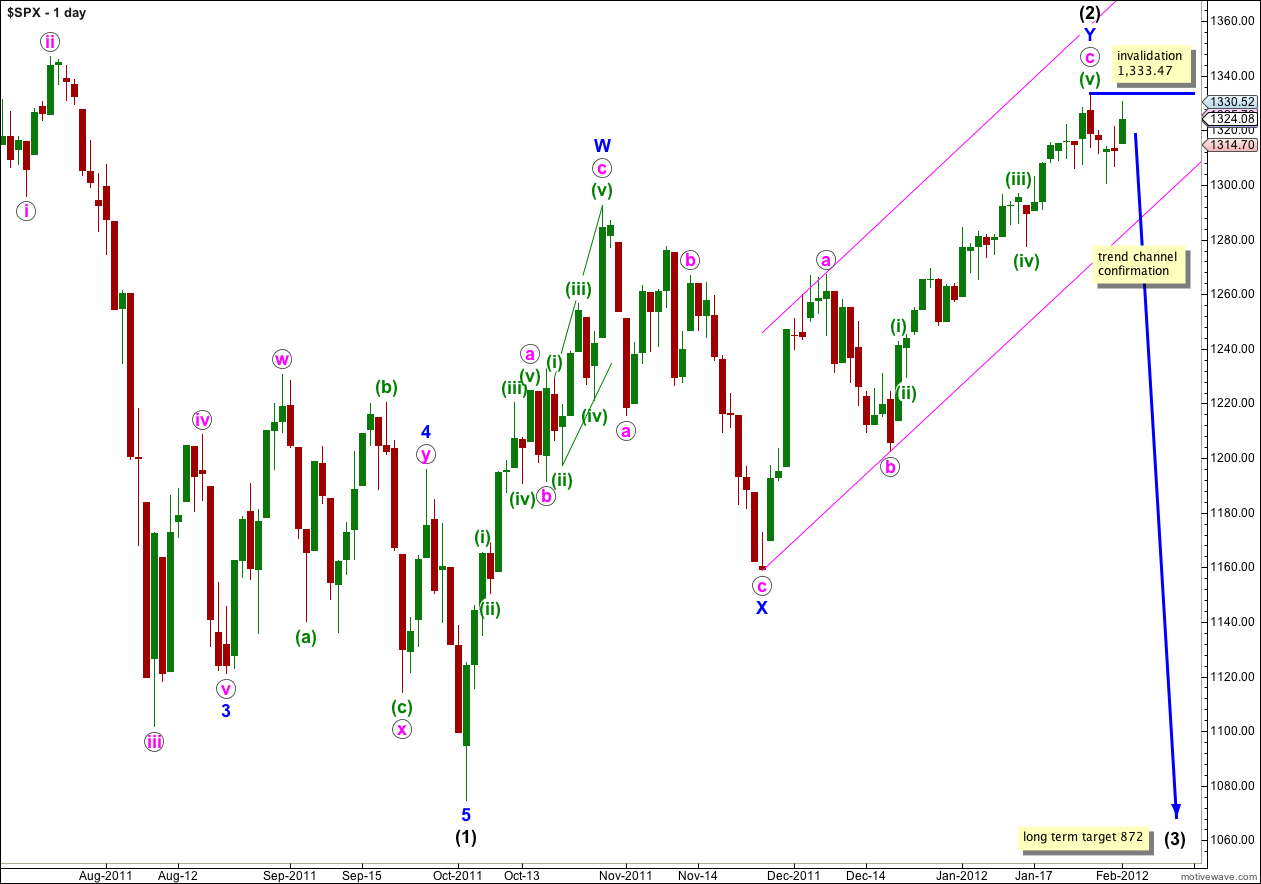
Wave (3) black would reach 1.618 the length of wave (1) black at 872 and this long term target is months away. Wave (1) black lasted 4 months and wave (2) black lasted 3 months. We may expect wave (3) black to last at least 2 months and possibly longer.
When the parallel channel containing wave Y blue zigzag is breached by downwards movement then we shall have final confirmation of this big trend change. Now that it is more likely that a leading diagonal is unfolding in a first wave position this trend channel confirmation is likely a little longer away than initially expected; normally diagonals take longer to unfold than impulses.
Wave (2) black is labeled here as a double zigzag structure, which is relatively common. The only way wave (2) black could continue further sideways when the second zigzag of Y blue is over is as a rare triple zigzag. The rarity of triples means this has a very low probability. Furthermore, the purpose of triple zigzags is to deepen corrections. Wave (2) black is already a very deep correction of wave (1) black and it does not need to be deepened further.
The probability that wave (3) black has begun is very high.
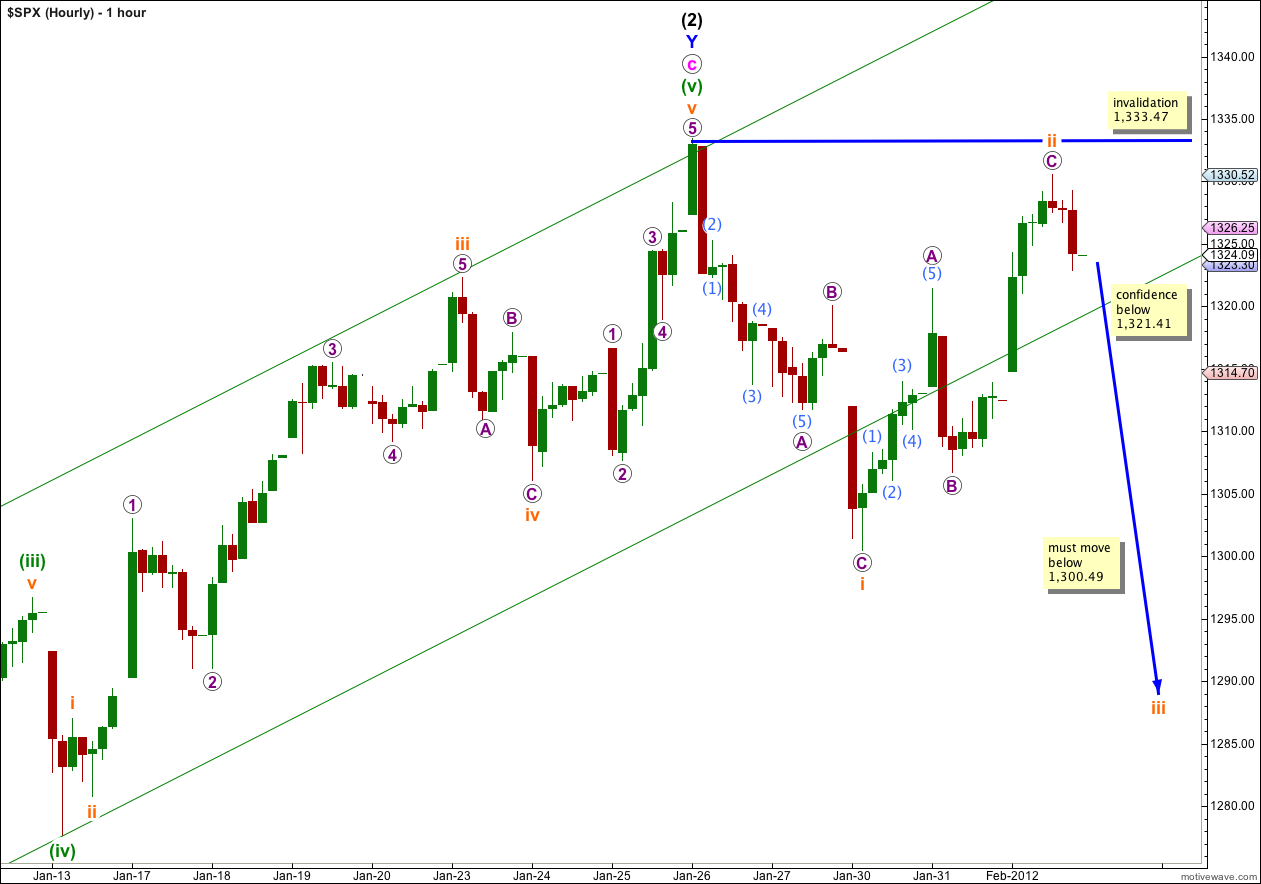
We now have a 5-3-5 zigzag downwards labeled i orange, followed by a 5-3-5 zigzag upwards which did not make a new high so this wave count remains valid. Wave C purple of wave ii orange ended 2.52 points above our short term target.
When price moves below 1,321.41 then the structure for wave ii orange as a zigzag would be confirmed. At that stage downwards movement could not be a fourth wave correction within a new impulse upwards as a fourth wave may not move into first wave price territory.
Movement below 1,321.41 would confirm the structure of waves i and ii orange as zigzags and provide more confidence that price should continue lower to a new low below the end of wave i orange at 1,300.49.
Within a diagonal there is not normally a Fibonacci ratio between actionary waves 1, 3 and 5. This makes it difficult to calculate a target for wave iii orange. Wave iii orange of the diagonal must move beyond the end of wave i orange and must make a new low below 1,300.49.
Thereafter, wave iv orange must move back into wave i orange price territory, but may not move beyond the end of wave ii orange.
Wave iii orange may be either a zigzag or an impulse. If one of the three actionary waves of a diagaonal is to be an impulse it is often the third wave. Again, this makes target calculation difficult when the structure is an unknown.
It is likely that wave iii orange would be at least the length of wave i orange which is achieved at 1,298. It is reasonably likely to be longer.


well, we did not go down, tomorrow is a critical day for the jobs report, right? In the last days, we have not much too much, maybe the job report result may move the spx in a higher range.