
As expected price moved lower during Friday’s session, close to the lower edge of the parallel channel on the hourly chart but falling short of that trend line a little. If price breaks through this channel next week then our wave count will increase in probability significantly. At that stage I will calculate targets for the next movement, but while we have no confirmation of a trend change it would be premature to do this.
Click on the charts below to enlarge.
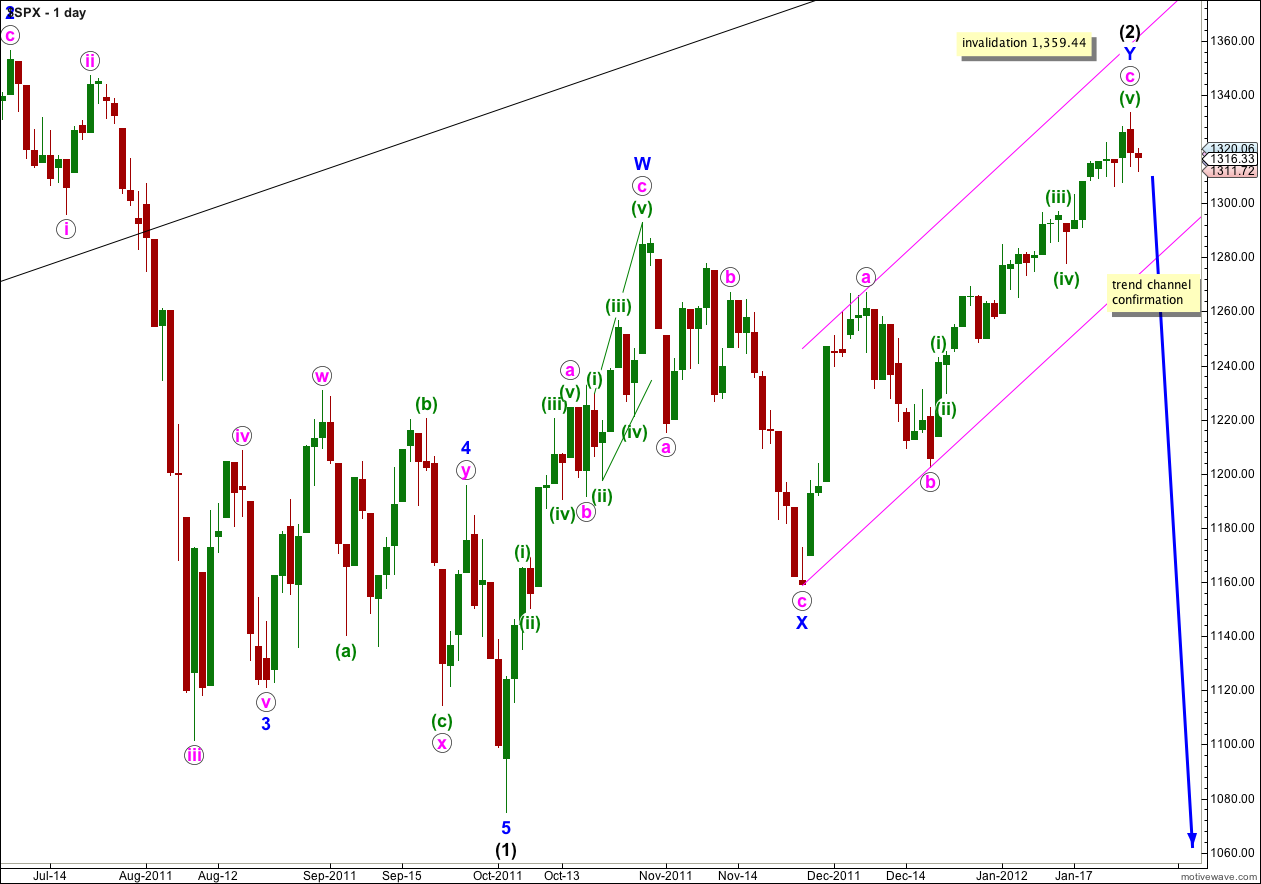
Wave (2) black is a very deep 91% correction of wave (1) black.
It would be wise to approach this market with caution at this stage. We may use the pink parallel channel about the zigzag of wave Y blue in the manner Elliott intended to finally confirm this trend change. When there is a full daily candlestick below the parallel channel we shall have confirmation of a trend change.
Wave (2) black is labeled here as a double zigzag structure, which is relatively common. The only way wave (2) black could continue further sideways when the second zigzag of Y blue is over is as a rare triple zigzag. The rarity of triples means this has a very low probability. Furthermore, the purpose of triple zigzags is to deepen corrections. Wave (2) black is already a very deep correction of wave (1) black and it does not need to be deepened further.
Wave (2) black may not move beyond the start of wave (1) black. This wave count is invalidated with movement above 1,359.44.
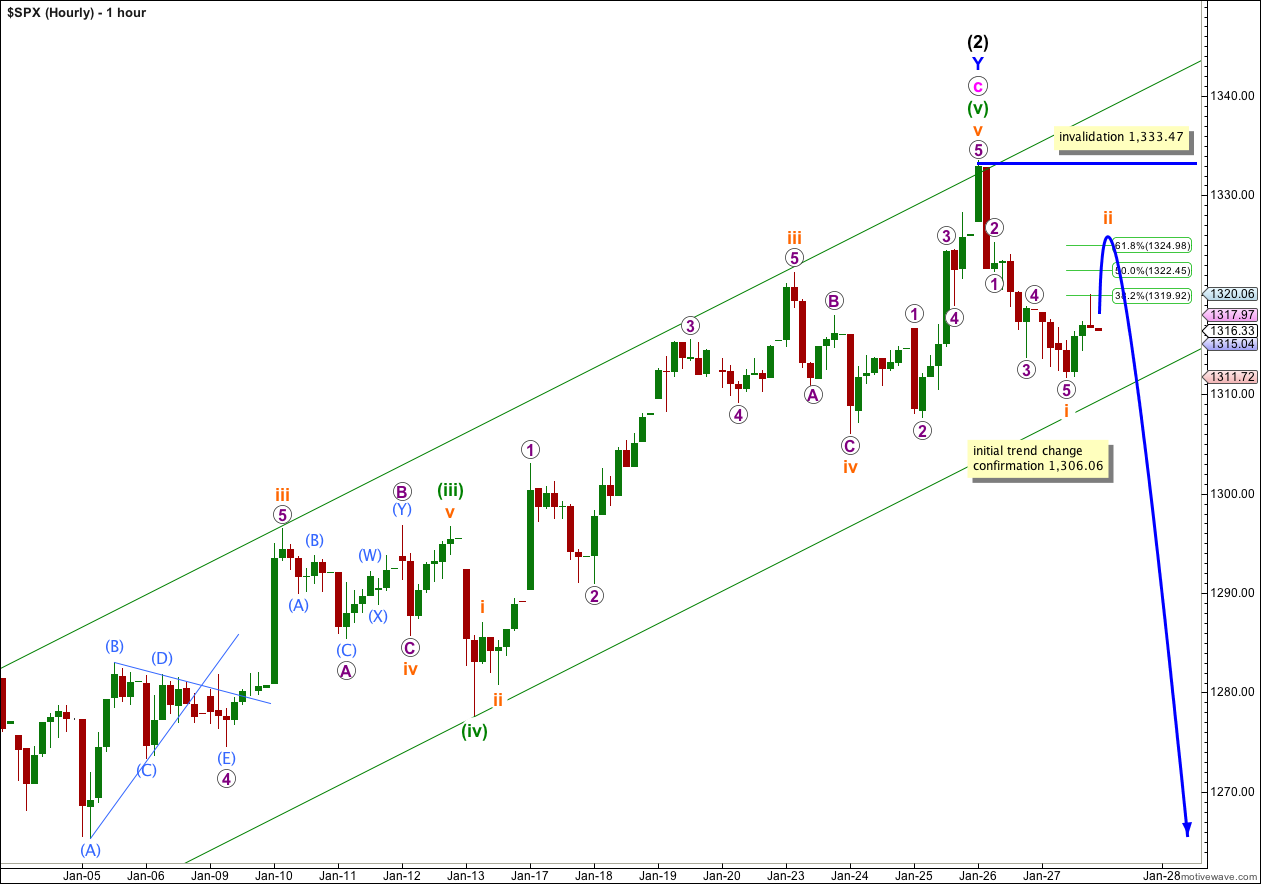
Downwards movement is a clear five wave impulse on the five minute chart. The following upwards movement is probably the start of a second wave correction labeled here ii orange.
We may expect ii orange to correct to about the 0.618 Fibonacci ratio of wave i orange, because that is most common for second waves.
Thereafter, if this wave count is correct, wave iii orange should have the momentum to break through resistance taking price outside of this parallel channel and providing us with our first early confirmation of a trend change.
Movement below 1,306.06 would be strong indication of a trend change as at that stage downwards movement may not be a second wave correction within v orange of (v) green, and so wave v orange would have to be over.
Wave ii orange may not move beyond the start of wave i orange. This wave count is invalidated with movement above 1,333.47.
If this wave count is invalidated with upwards movement we should look closely at the Dow. If the Dow wave count is invalidated at the daily chart level then I will be using my recently developed second alternate historic wave count for the S&P 500.
An invalidation at this stage is significant, and changes the long term outlook from bearish to bullish. The mid term outlook remains however bearish, for the next few months. But a new low below 666.79 would be not expected.