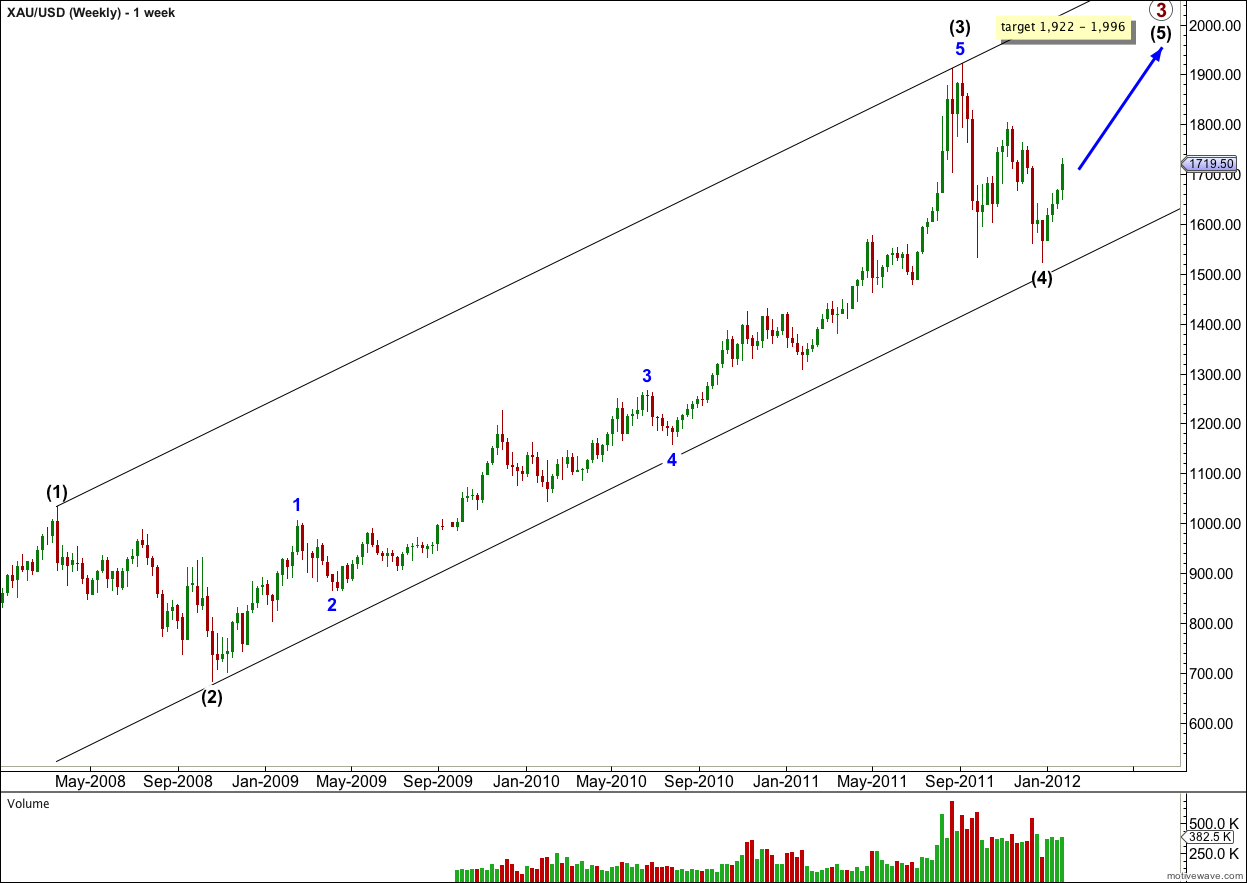
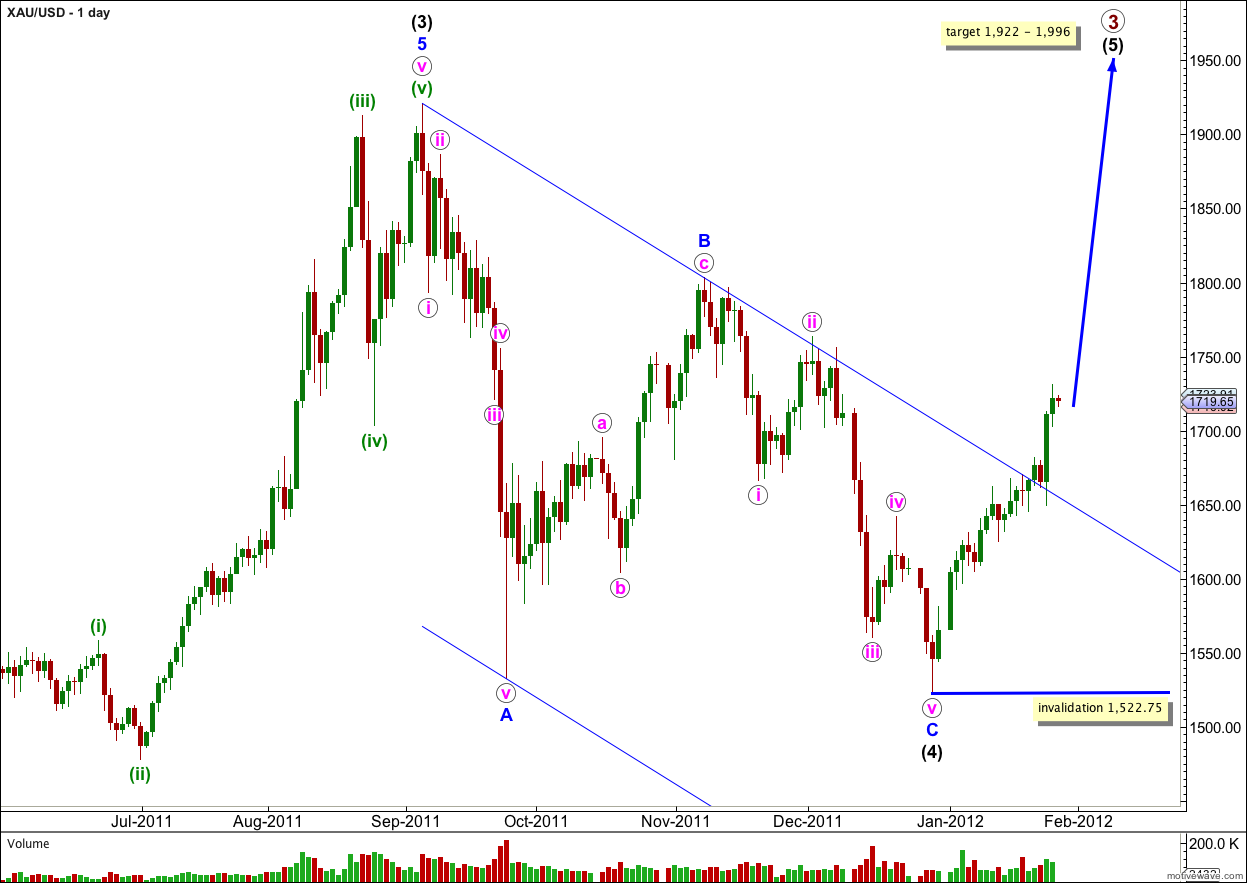
As requested from members, here are weekly and daily charts for gold. I will publish only charts and a brief explanation without video.
Click on the charts below to enlarge.
The target is calculated at intermediate and primary degree.
Wave (3) black was just 0.36 short of a perfect 2.618 the length of wave (1) black.
At 1,996 wave (5) black would reach equality in length with wave (3) black.
At 1,922 primary wave 3 would reach 2.618 the length of primary wave 1.
This gives us a $74 target zone for this last wave up to end.
At that point gold should be due for a larger correction at primary degree which may not move back into primary wave 1 price territory at 1,032.70.
This last wave up should take months to unfold.
Using Elliott’s technique to draw a parallel channel about the zigzag downwards for wave (4) black shows this channel is clearly breached by upwards movement. We may take that as confirmation that the downwards correction is over and the next wave is underway.
Within wave (5) black no second wave correction may move beyond the start of a first wave. This wave count is invalidated with movement below 1,522.75.


The recent move up in gold almost perfectly matched your blue B wave. It seems that this latest wave could have been Wave 4 and the wave you have as blue B would have been Wave 2. Wave 5 would need to be shorter than wave 3 so it would not be able to extend much lower than 1522. Curious to see if you think that is a possibility. Thanks
thanks lara