
Upwards movement has reached to 1,315.49, 4.49 points above our target. We have three alternate hourly wave counts today: one which sees this trend as over and two which allow for further upwards movement. We can use invalidation and confirmation points to work with these three alternates, and we should use the parallel channel on the daily chart for final confirmation of a trend change.
Click on the charts below to enlarge.
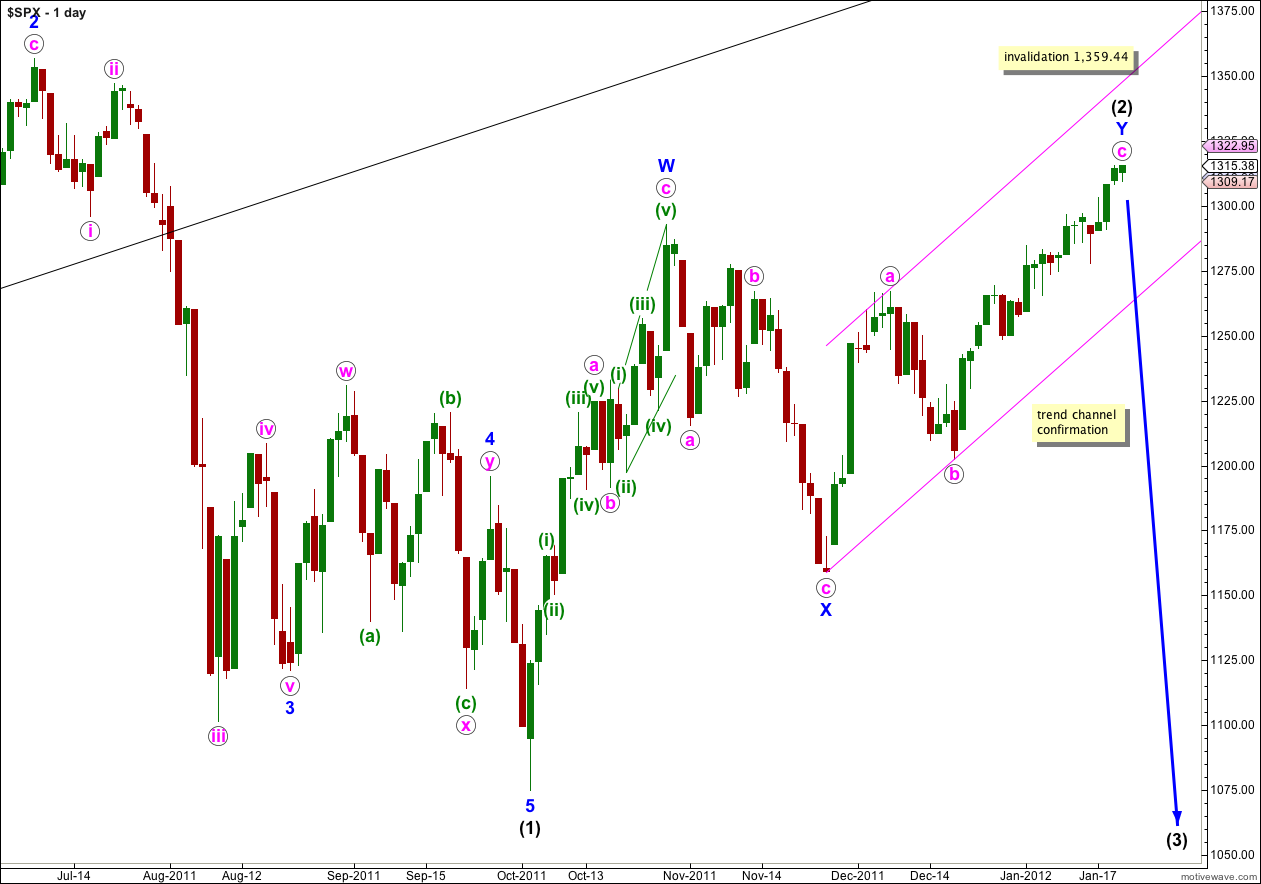
I have reordered the hourly wave counts. The main hourly wave count sees the structure for wave c pink and therefore wave (2) black in its entirety as complete. However, this trend change is unconfirmed and will not be until price moves below the parallel channel here and below 1,242.82.
If wave (2) black is over as a double zigzag then it lasted 74 days, compared to wave (1) black which lasted 102 days. Wave (2) black is an 85% correction of wave (1) black.
Within wave Y blue, the second zigzag of wave (2) black, wave c pink is just 4.61 points longer than equality in length with wave a pink. Waves a and b pink lasted a Fibonacci 8 days, and wave c pink may have lasted a Fibonacci 21 days.
When a trend change is confirmed I will calculate targets for wave (3) black downwards. It would be premature to do this today. Wave (3) black must take price beyond the end of wave (1) black at 1,074.77, far enough below this point to allow for movement for wave (4) black to not move back into wave (1) black price territory.
When we have a full daily candle below and not touching the pink parallel channel then we shall have confirmation of a trend change.
There exists the slim possibility that wave (2) black could continue further as a rare triple zigzag structure. This possibility has a very low probability for two reasons; triple zigzags are very rare, and their purpose is to deepen a correction. The correction is already 84% of wave (1) black and it should not need to deepen further.
Main Hourly Wave Count.
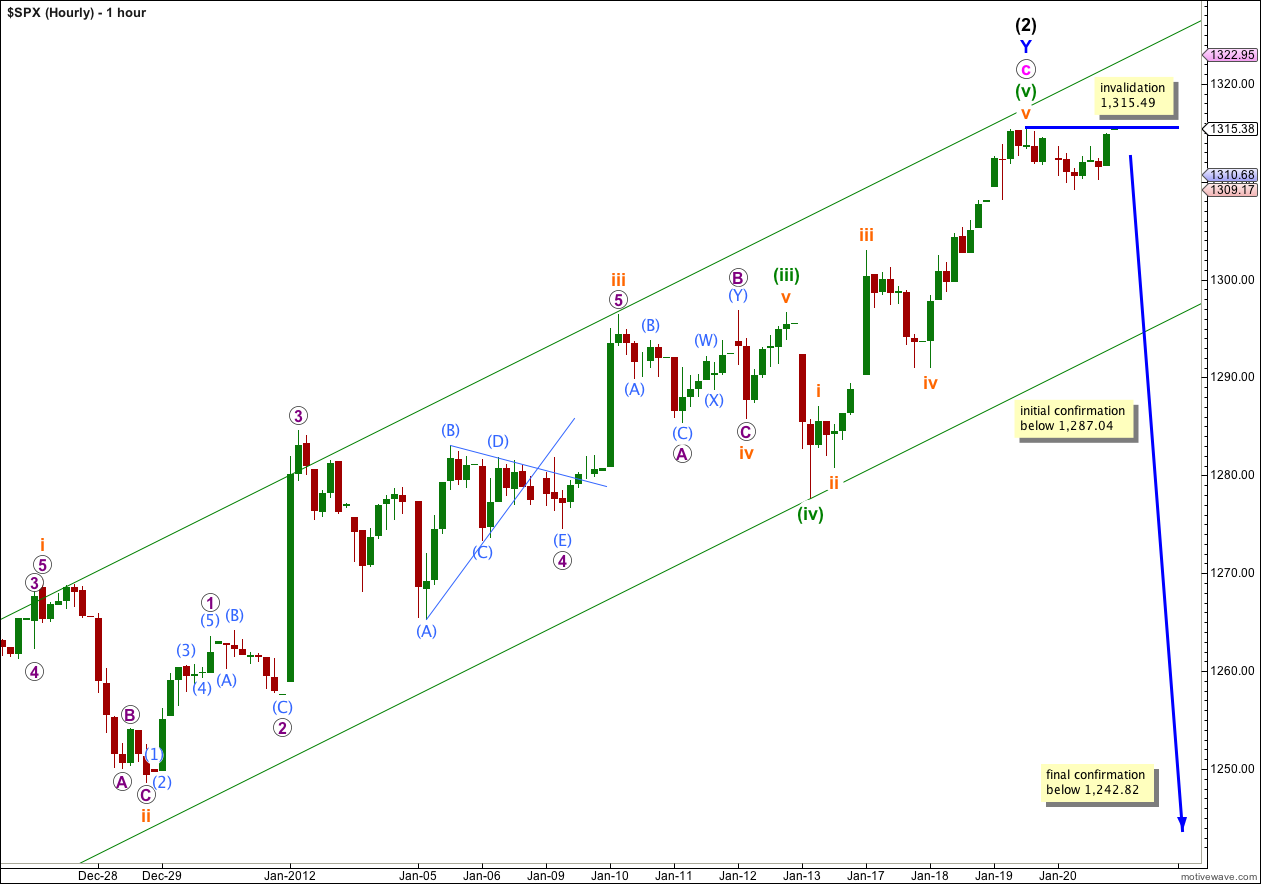
If wave c pink is over then ratios within it are: wave (iii) green is just 1.7 points longer than 1.618 the length of wave (i) green, and wave (v) green is 2.57 points short of equality with wave (i) green. The structure is very typical and the ratios are excellent.
Ratios within wave (v) green are: wave iii orange has no Fibonacci ratio to wave i orange, and wave v orange is just 0.19 points short of 2.618 the length of wave i orange.
Movement below 1,287.04 would provide some indication that a trend change was likely, and at that stage our first alternate wave count would be invalidated.
Movement below 1,242.82 would provide final confirmation of a trend change. At that stage our second alternate would also be invalidated and price would be outside the parallel channel on the daily chart.
When we have some confirmation of a trend change then I will calculate a mid term target for wave (3) black. It is premature to do so with no confirmation.
If price moves above 1,315.49 to a new high then we should use the first alternate wave count below.
Alternate Hourly Wave Count.
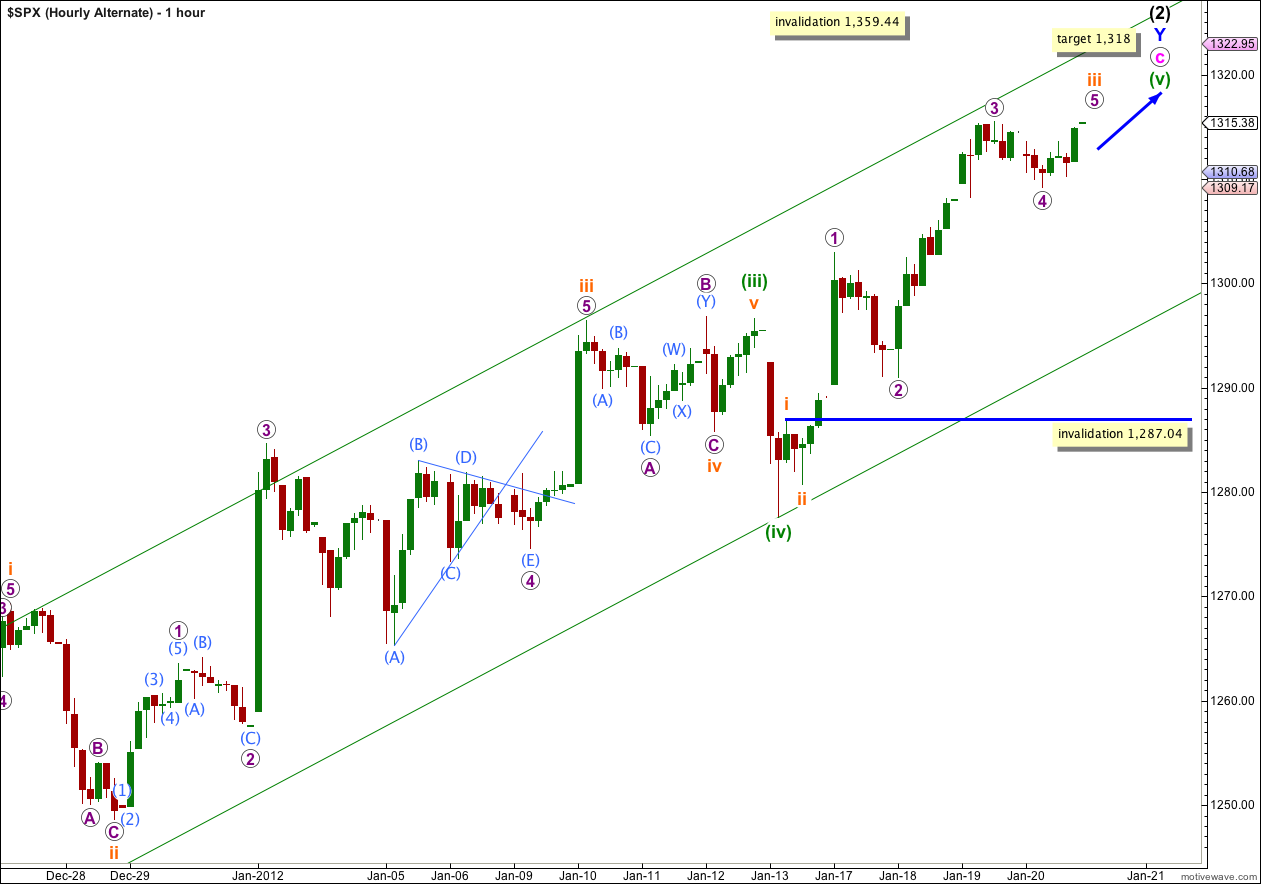
By simply moving the degree of labeling within part of the last upwards movement down one degree we see that we may have yet a little more upwards movement.
Within wave (v) green here wave iii orange may be extending.
At 1,318 wave (v) green would reach equality with wave (i) green. If price reaches this first target and keeps rising then the next target would be at 1,345 where wave (v) green would reach equality in length with wave (iii) green. The first target is more likely because it still allows for a reasonable Fibonacci ratio at pink degree also.
Within wave (v) green wave iv orange may not move into wave i orange price territory. This wave count is invalidated with movement below 1,287.04.
If price moves below 1,287.04 then the main hourly and second alternate hourly wave counts will remain valid. The main hourly will have the highest probability.
Second Alternate Hourly Wave Count.
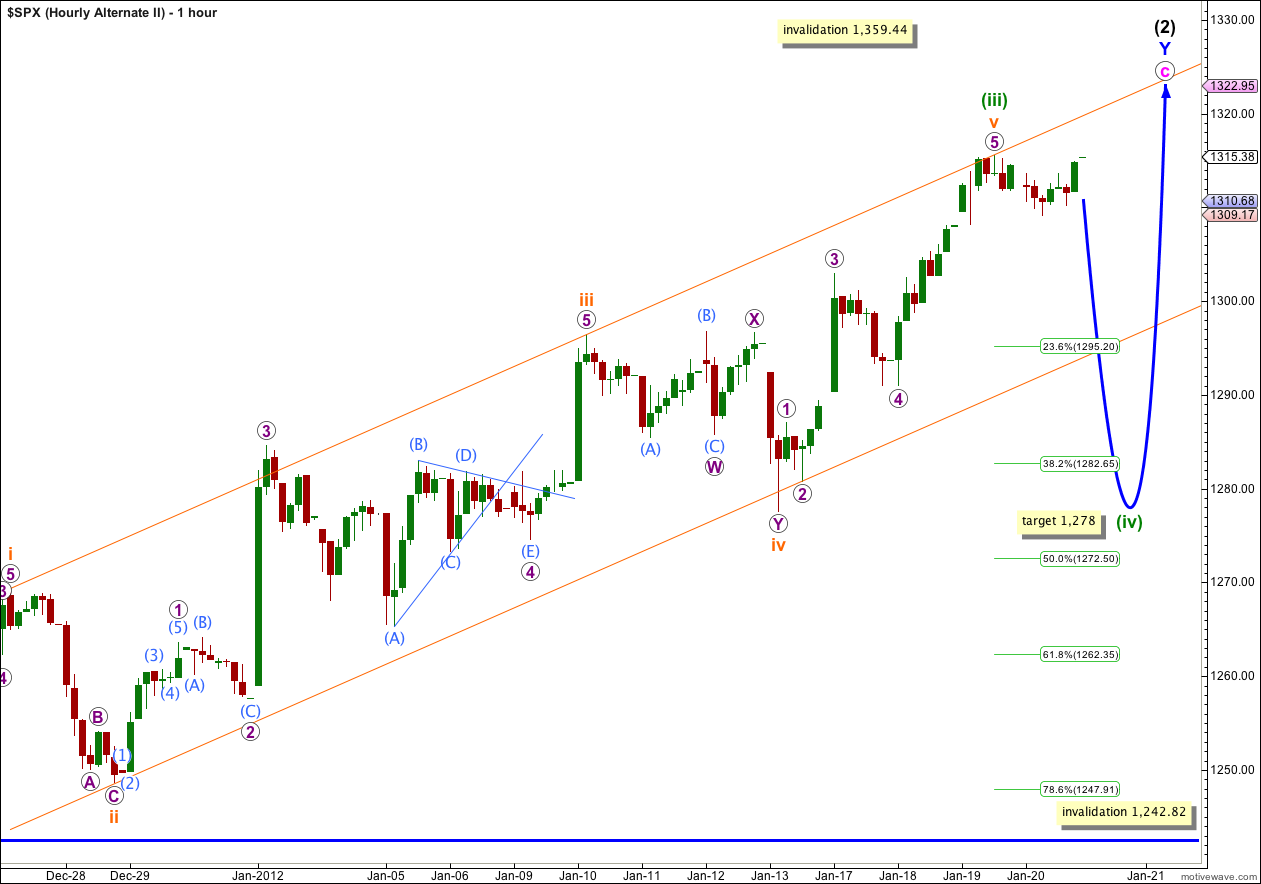
We may only have seen the end to wave (iii) green within wave c pink. Waves (iv) and (v) green may yet be unfolding.
The parallel channel drawn here about wave (iii) green perfectly showed where wave v orange ended. I would expect, if this wave count is correct, for wave (iv) green to breach this parallel channel.
Wave (ii) green was a shallow zigzag and we should expect wave (iv) orange to be a deep correction, over 50%. Another likely place for fourth waves to end is about the fourth wave of one lesser degree; wave iv orange ended at 1,278.
When we have waves a and b orange within wave (iv) green complete then this target for it to end will probably change. We may use the ratio between waves a and c to recalculate the target.
Wave (iv) green may not move into wave (i) green price territory. This wave count is invalidated with movement below 1,242.82.