
Analysis for the next two sessions will be done by Hugo Venter. I will be away from home on a small island without Internet coverage. I will converse with Hugo in the afternoon of the next New York session (Wednesday’s session) and give him my thoughts on that analysis. After I return I will read Hugo’s analysis of the Thursday session and I will post an update if I see anything to add or alter. So you will have my input for both of Hugo’s analyses.
The S&P 500 has moved higher which was expected, before turning lower again. The structure on the 5 minute chart is exactly as our wave count expected. We should see the continuation of this trend to our target.
Click on the charts below to enlarge.
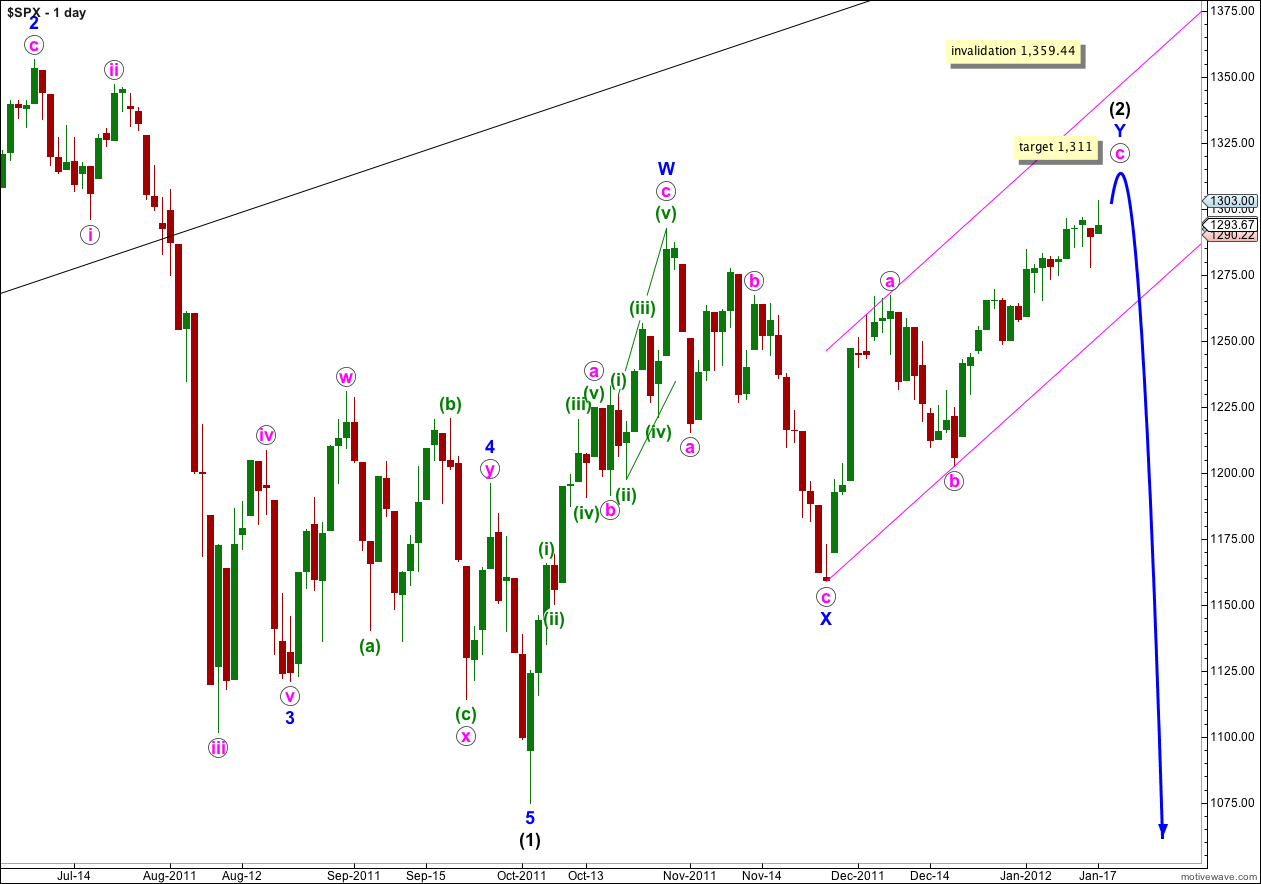
Price continues to move overall higher about the mid line of the parallel channel containing wave Y blue zigzag, as we expect. The structure of wave c pink is still incomplete. We should expect this week further overall upwards movement, with downwards and sideways corrections along the way.
Waves a and b pink both lasted a Fibonacci 8 days. Wave c pink has now lasted 18 days. The next Fibonacci number in the sequence is 21 which would see wave c pink end this Thursday the 19th of January. However, Fibonacci time relationships are not as reliable as Fibonacci price ratios between waves so this date is a rough guide only.
When this parallel channel is breached by downwards movement then we shall have confirmation that wave Y blue zigzag is over and wave (3) black downwards should be underway.
Wave (2) black is a double zigzag, which is a relatively common structure. Triple zigzags are relatively rare structures, and when the second zigzag for wave Y blue is complete the probability that wave (2) is over will be very high.
Wave (2) black may not move beyond the start of wave (1) black. This wave count is invalidated with movement above 1,359.44.
There are two ways to look at most recent movement and we still have main and alternate hourly wave counts. We may have to run them side by side until one or the other is invalidated.
Main Hourly Wave Count.
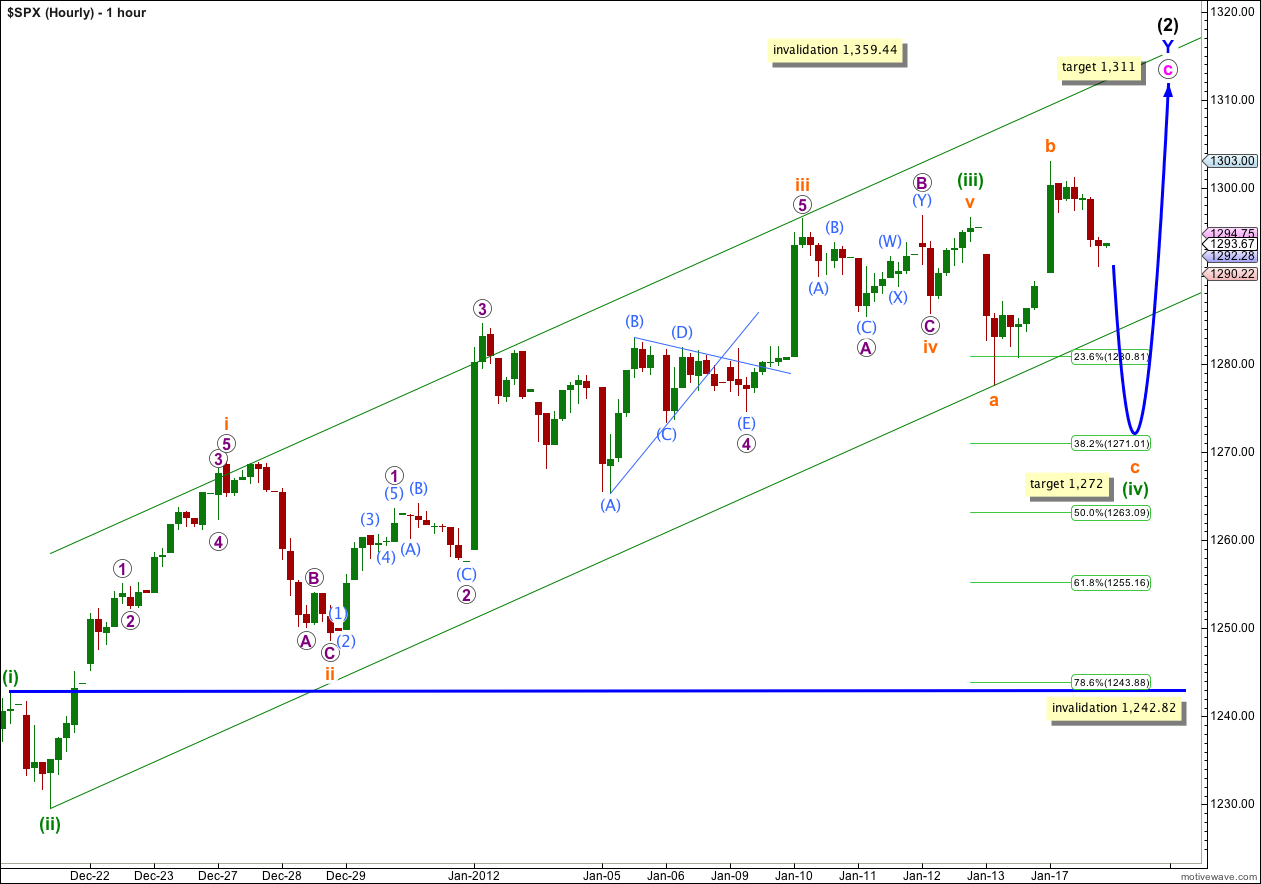
This main hourly wave count has the best fit in terms of proportions, and for that reason it may have a slightly higher probability than the alternate.
Using Elliott’s channeling technique about green wave degrees does not produce a satisfactory parallel channel, and this channel as drawn here is a best fit. If my expectations for wave (iv) green to end at the target calculated are correct then this parallel channel would have an overshoot.
Wave (iv) green looks like it is unfolding as a typical expanded flat correction. Wave b orange is a 133% correction of wave a orange, and on the 5 minute chart both these waves most easily break down into threes. Wave c orange would reach 1.618 the length of wave a orange at 1,272, making this fourth wave correction end about the 0.382 Fibonacci ratio of wave (iii) green.
Wave c orange is extremely likely to move to a new low below the end of wave a orange at 1,277.61 to avoid (another) rare running flat correction.
This would provide alternation in structure but not in depth of correction between waves (ii) and (iv) green. That’s okay, alternation is a guideline not a rule and it would still be achieved.
When we know where wave (iv) green has ended then we may calculate a more accurate target for wave (v) green to complete wave c pink. We cannot do that today.
Wave (iv) green may not move into wave (i) green price territory. This wave count is invalidated with movement below 1,242.82.
This price point, 1,242.82, will provide us with strong indication that wave (2) black is over. When we see movement below this price point then we know that wave c pink must be over, and wave Y blue and (2) black must also therefore be over.
Alternate Hourly Wave Count.
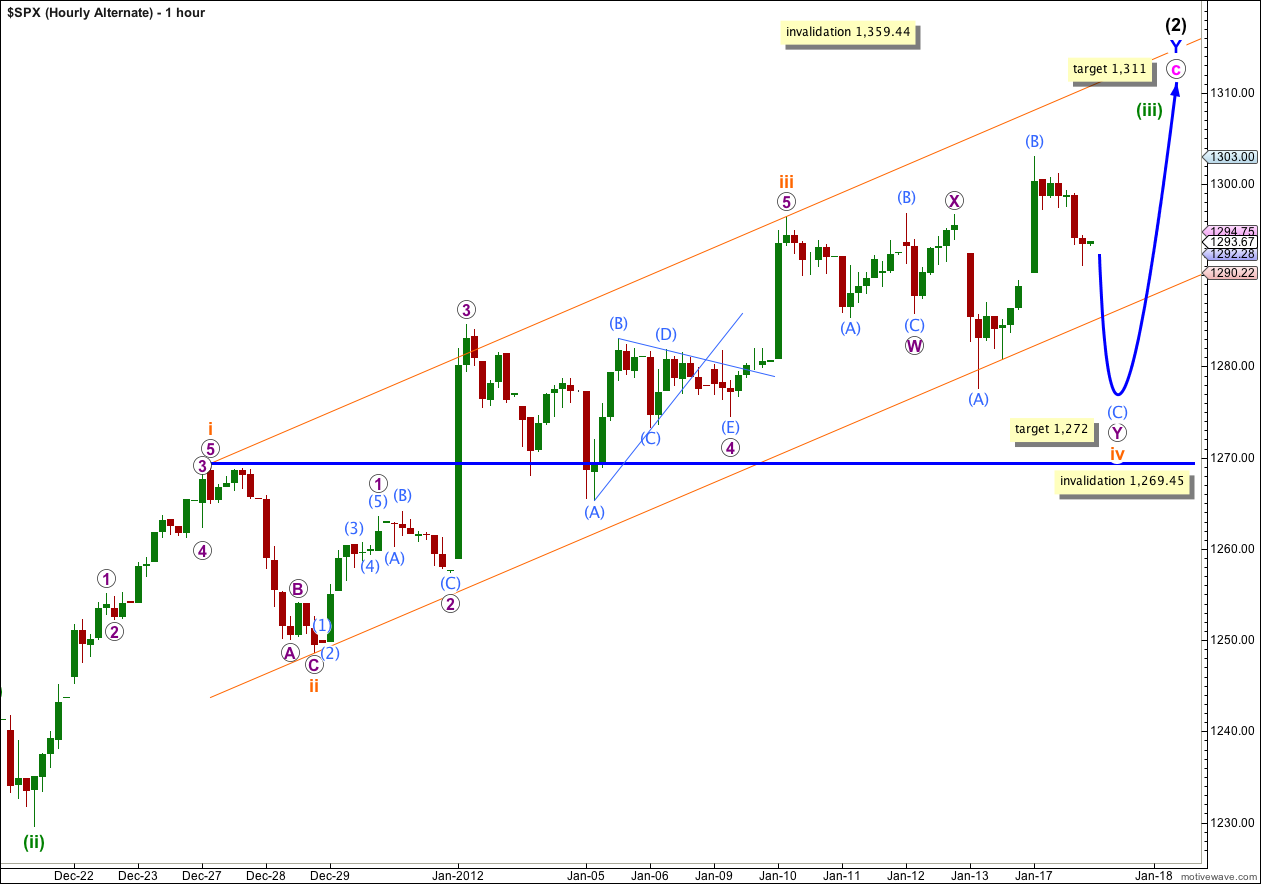
For this alternate wave count wave iv orange now looks out of proportion to wave ii orange. This does not invalidate the wave count, it just reduces its probability.
The subdivisions on the 5 minute chart for this alternate are not quite as satisfactory as for the main wave count; specifically the upwards wave labeled here X purple. It is seen here as a three, for the main wave count it is seen as a five. It fits better as a five. This reduces the probability that this alternate wave count is correct.
This alternate wave count has the same expectation for next movement as the main wave count, and the targets for it are the same. This alternate expects one more fourth wave correction on the way up though than the main wave count.
The parallel channel drawn here is Elliott’s first technique. Wave iv orange may overshoot this channel, and if it does we shall redraw it using Elliott’s second technique to show us where wave v orange may likely end.
Within wave iv orange double flat correction, wave W purple is a running flat and wave Y purple is so far likely to be an expanded flat correction.
If wave Y purple is a typical expanded flat then wave (C) aqua would reach 1.618 the length of wave (A) aqua at 1,272.
Wave iv orange may not move into wave i orange price territory. This wave count is invalidated with movement below 1,269.45.