
We had expected upwards movement as most likely for Friday’s session and this is not what happened. However, price remains above the invalidation point, the wave count remains valid, and we should expect this trend to continue as expected next week. There is a high probability that the target will be reached.
Click on the charts below to enlarge.
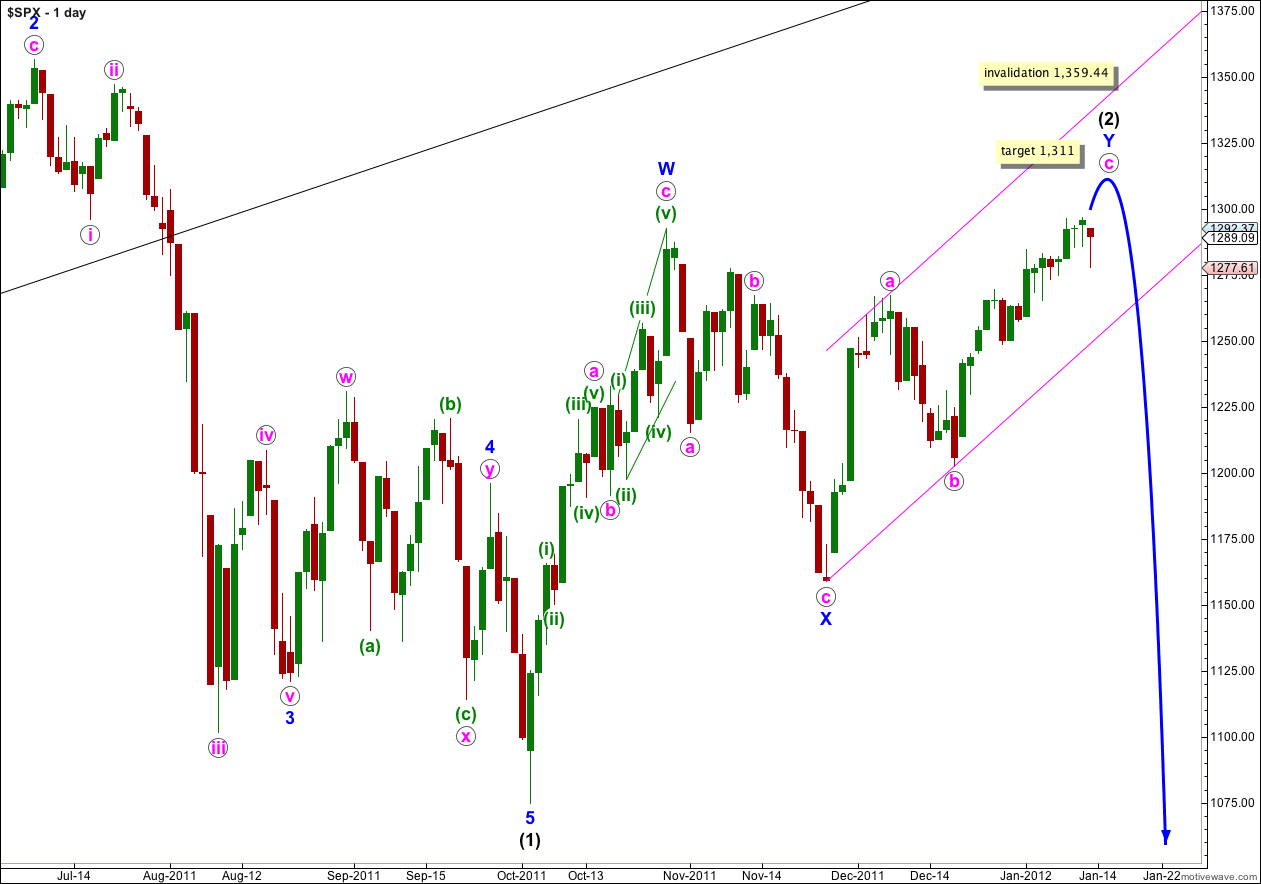
The structure of wave c pink is still incomplete. It is still on target to end about 1,311, possibly next Thursday give or take a day either side.
Waves a and b pink both lasted a Fibonacci 8 days. Wave c pink has now lasted 17 days. The next Fibonacci number in the sequence is 21 which would see wave c pink end next Thursday the 19th of January. However, Fibonacci time relationships are not as reliable as Fibonacci price ratios between waves so this date is a rough guide only.
When this parallel channel is breached by downwards movement then we shall have confirmation that wave Y blue zigzag is over and wave (3) black downwards should be underway.
Wave (2) black is a double zigzag, which is a relatively common structure. Triple zigzags are relatively rare structures, and when the second zigzag for wave Y blue is complete the probability that wave (2) is over will be very high.
Wave (2) black may not move beyond the start of wave (1) black. This wave count is invalidated with movement above 1,359.44.
Yesterday’s main hourly wave count was not invalidated by price movement, but the subdivisions do not work on the 5 minute chart.
There are two ways to look at Friday’s downwards movement and we have a main and alternate hourly wave count to end the week.
Main Hourly Wave Count.
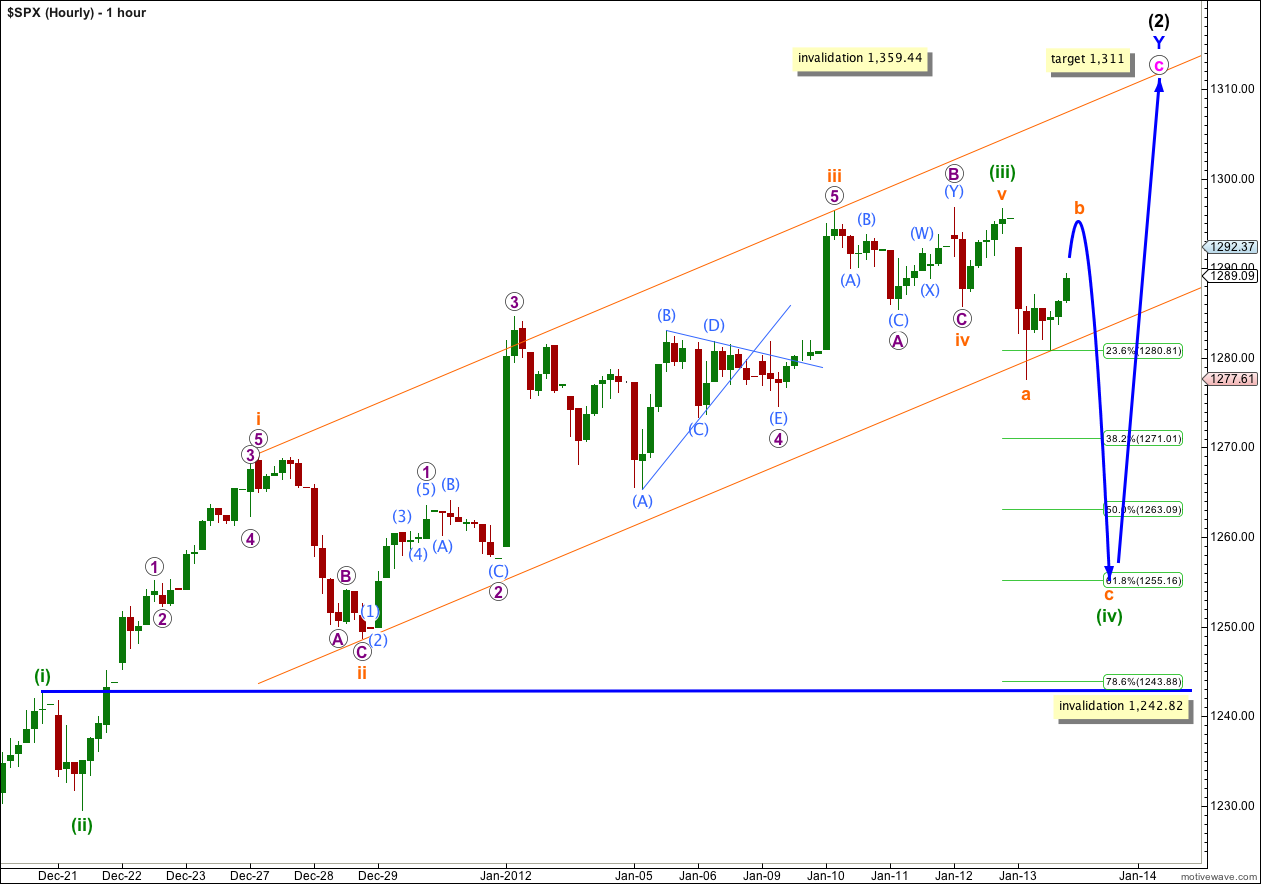
It is possible that wave (iii) green is complete. If it was over at 1,296.66 then wave v orange is just 0.40 points short of 0.236 the length of wave iii orange. There is no Fibonacci ratio between waves i and iii orange.
The upwards piece of movement labeled v orange is ambiguous. On the 5 minute chart it can be seen as an impulse, or as a zigzag. This main hourly wave count sees it as an impulse.
What is not ambiguous on the 5 minute chart is the downwards piece of movement labeled a orange within (iv) green: it is a zigzag. This means that the probability we shall yet see new highs next week is high as corrections are still trending downwards and impulses upwards. This trend is not yet over.
The Fibonacci retracement is drawn along the length of wave (iii) green. Wave (ii) green was a shallow zigzag. Given the guideline of alternation we may expect wave (iv) green to be a deeper correction. We should favour the 0.618 Fibonacci ratio as a target for wave (iv) green to end about 1,255. Wave (iv) green may be a flat, triangle, double zigzag or combination correction. At this stage a double zigzag seems most likely.
Wave (iv) green should clearly breach the parallel channel containing wave (iii) green. Elliott’s channeling technique may not be useful here about green waves to show us where wave (iv) green may end due to the very small size of (ii) green.
Wave (iv) green may not move into wave (i) green price territory. This wave count is invalidated with movement below 1,242.82.
Movement below 1,269.45 would invalidate the alternate hourly wave count below and confirm this main wave count.
Wave (iv) green may take another one to three days to end.
Alternate Hourly Wave Count.
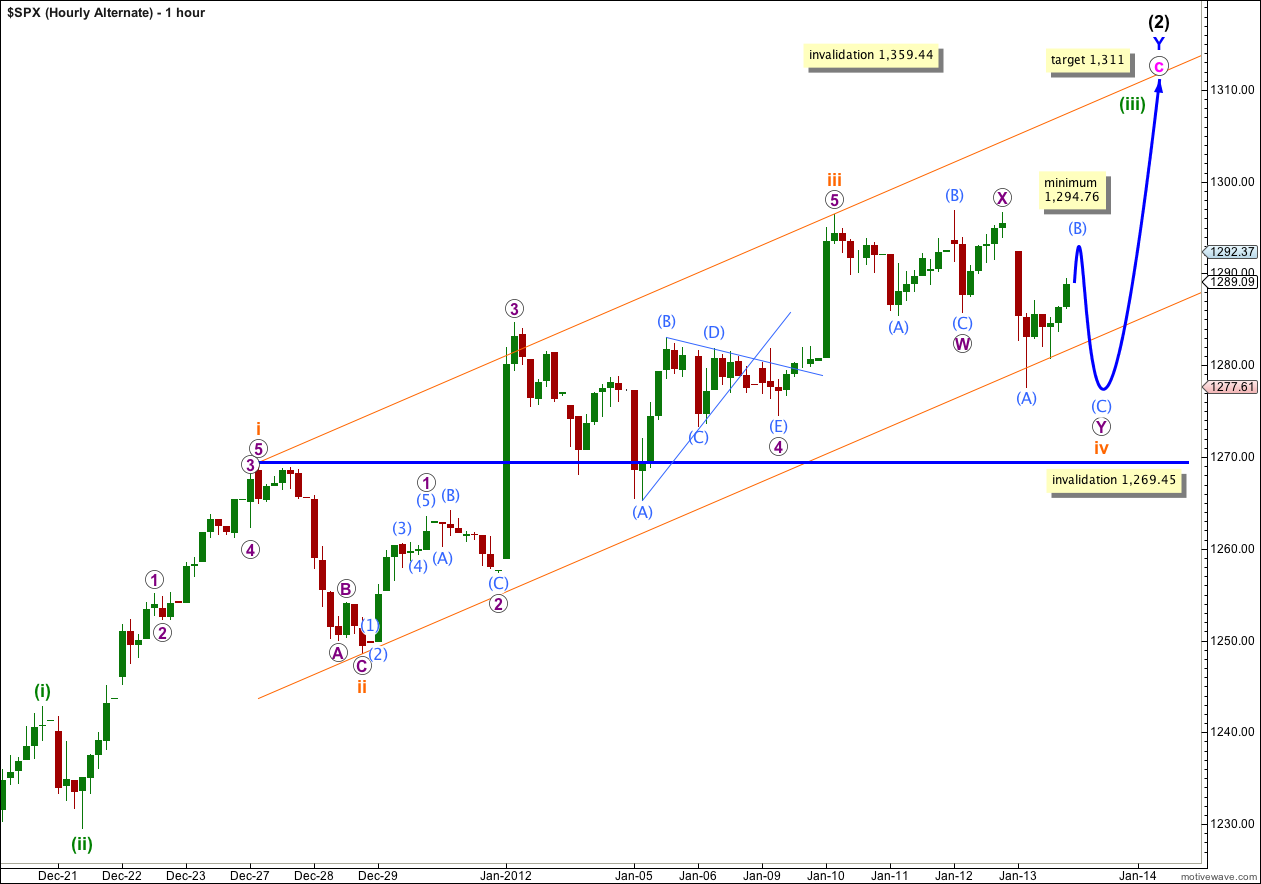
It is possible that wave iv orange is incomplete and is continuing sideways as a double flat correction. However, the purpose of a double flat is to move price sideways and Friday’s downwards movement has moved this correction reasonably lower. This possible double flat does not have quite the right look, and because of this reason I favour this alternate wave count less than the main hourly wave count.
If wave Y purple is a flat correction then wave (B) aqua within it must reach at least 90% the length of wave (A) aqua. This would be achieved at 1,294.76.
It is also possible that wave iv orange is unfolding as a double combination correction with wave Y purple to complete a triangle. A triangle does not require wave (B) aqua to be 90% the length of wave (A) aqua and this minimum may not be met. However, double flats are more common than double combinations, particularly with triangles as the second structure.
Wave iv orange may not move into wave i orange price territory. This wave count would be invalidated with movement below 1,269.45.
Lara, what would be the target value for b orange?
Walter, I’m sorry I missed answering your question earlier. Thanks for reposting it.
I’ve deliberately not given a target for b orange for the main hourly wave count because this correction may at this early stage be one of several different structures.
The downwards movement labeled a orange is a three so wave (iv) green may be either a flat, triangle or a double. For a flat wave b orange must be 90% the length of a which would be at 1,249.76. For a triangle wave b orange does not have to be a minimum length and it could be over already. For a double zigzag or double combination wave b orange would be relabeled x orange and again does not have to reach a minimum length, it could be over already.
All this upwards movement needs to be is a three, whether we label it b orange or x orange.
If it moves higher and reaches 1,294.76 then wave (iv) green would be most likely a flat (or a double with a flat as the first structure).
Lara, the daily chart shows a breach (or close) below 1265 (or so) as a trend changer. Hourly chart anticipates a deeper retrace and new highs. Can you clarify?
If wave (iv) green reaches down to the .618 Fibonacci ratio of wave (iii) green then yes, it would take price below the parallel channel on the daily chart. If this happens it may create an “overshoot” of the channel. Only a proper trend channel breach, with a full daily candle below and not touching the lower trend line, would confirm a trend change.
Alternately I could have the expectation for a deep correction for (iv) green wrong; we may not see alternation in depth of correction between waves (ii) and (iv) green, we may only see alternation in structure. Wave (ii) green was a zigzag, wave (iv) green may be a flat, triangle or double. These tend to be shallow.
At this early stage I will expect full alternation in both depth and structure.
US Markets will close on Monday (Martin Luther King, Jr. Day)
Thanks Walter. We don’t celebrate MLK day here in New Zealand so I did not realise this was coming up.
There will be no data for Monday if NY is closed so there will be nothing to analayse. Next analysis will be for the Tuesday session.
Interesting that EWI’s Short Term Update is at a little at odds with your analysis at this very critical juncture. How exciting.
I like that your’s goes down to lower time frames.
My confidence is with you, Lara, realising that we are always dealing with probabilities. Regards, Gary
Thanks for the vote of confidence. Here’s hoping I can live up to it.
I stopped looking at EWI’s analysis a long time ago. They call trend changes too early; it’s a common problem with EW analysis to see the possibility of a trend change at several points along a wave length. My approach to this tendency is to use alternate wave counts at those points and explain the probability of each alternate. I think that’s the only way to get around the tendency of EW analysis to expect change more often than it occurs.