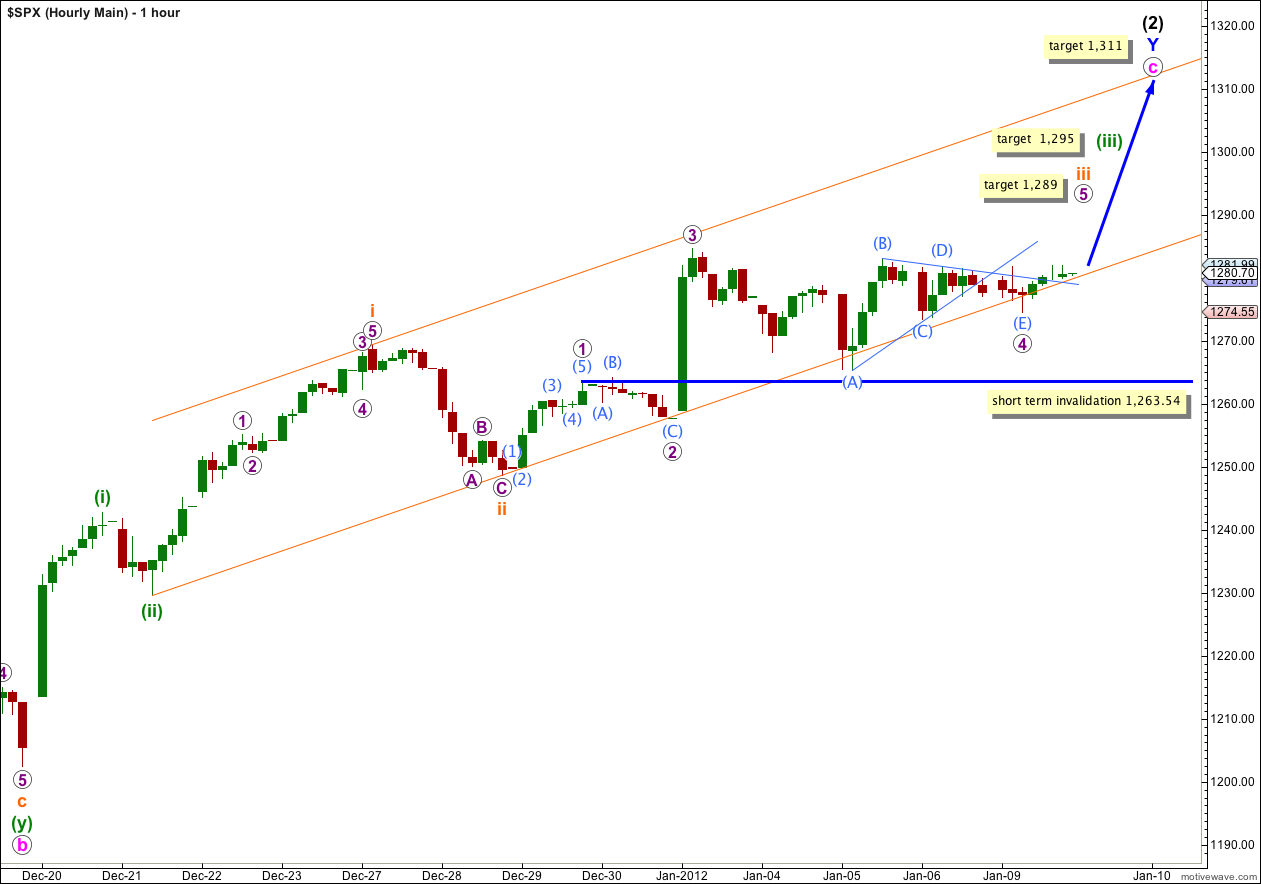
The fourth wave triangle remains valid and price has moved higher as expected. Price remains well contained within the parallel channel on the hourly chart, and it is likely to continue within this channel while the rest of this structure unfolds towards our targets.
Click on the charts below to enlarge.
Movement above 1,281.84 has indicated that the triangle is likely to be finally over and a fifth wave up should be underway. However, upwards movement so far is less than convincing. I would be a lot more confident that this fourth wave is over when we see movement above 1,283.05.
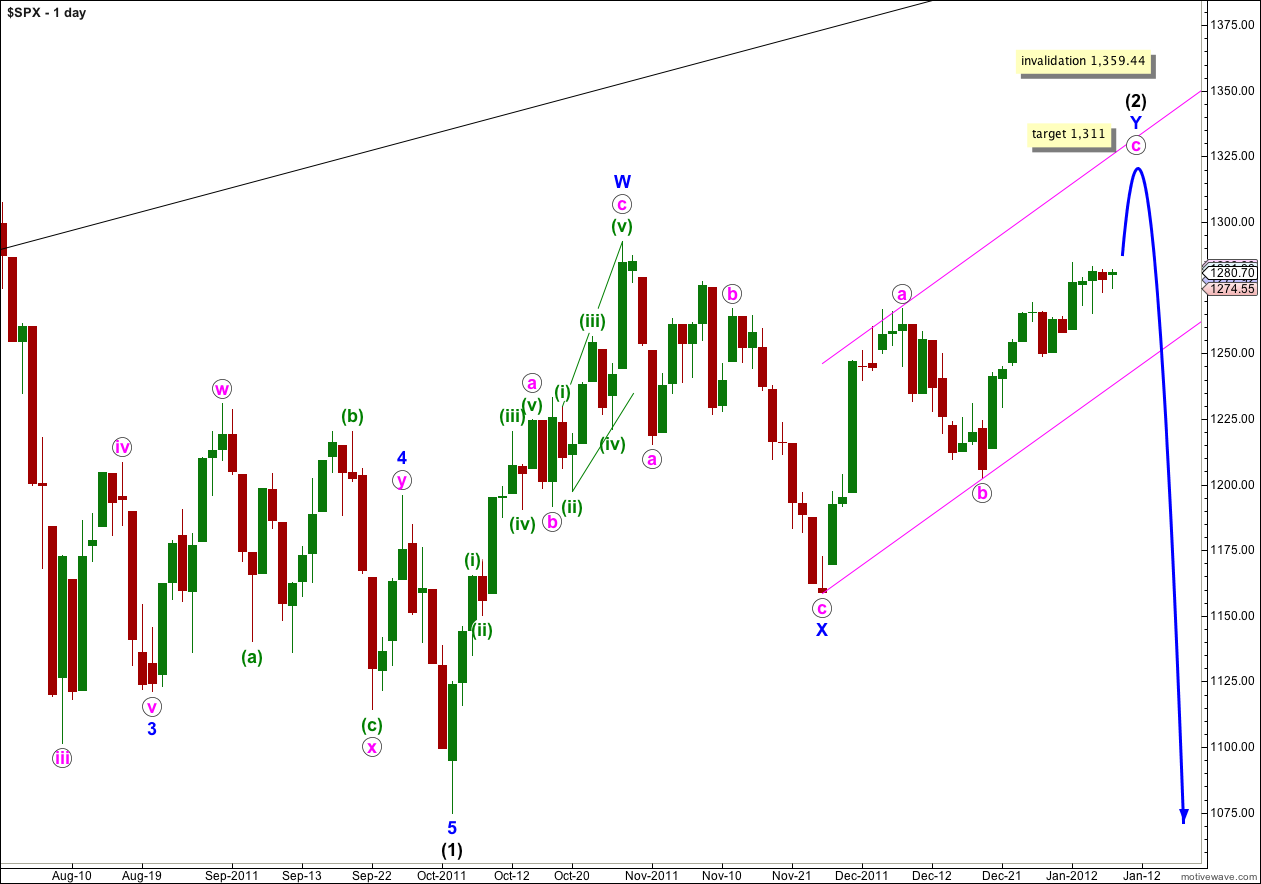
Wave c pink may end either mid way in the channel, or about the upper edge. At 1,311 wave c pink would reach equality with wave a pink.
When this parallel channel is breached by downwards movement then we shall have confirmation that wave Y blue zigzag is over and wave (3) black downwards should be underway.
Wave (2) black is a double zigzag, which is a relatively common structure. Triple zigzags are relatively rare structures, and when the second zigzag for wave Y blue is complete the probability that wave (2) is over will be very high.
Wave (2) black may not move beyond the start of wave (1) black. This wave count is invalidated with movement above 1,359.44.
We still have two hourly wave counts for the S&P 500. I strongly favour the main wave count mostly because the alternate does not work for the Dow.
Main Hourly Wave Count.
Price moved a little higher, but only very slightly above 1,281.84 to reach 1,281.99. The structure looks like more of the same sideways movement and the triangle may not yet be over. However, the triangle structure will remain valid as long as price does not move below the low labeled (C) aqua at 1,273.34.
With wave (E) aqua of the triangle moving a little lower the target for wave 5 purple changes. At 1,289 wave 5 purple would reach equality with wave 1 purple. Also at 1,289 wave iii orange would reach equality with wave i orange. This target has a high probability. The next upwards thrust may end here.
Thereafter, another fourth wave correction for wave iv orange should last at least one session, if not longer.
Wave (iii) green would reach 1.618 the length of wave (i) green at 1,295.
Thereafter, another fourth wave correction for wave (iv) green should last at least one session, if not longer.
A final upwards thrust for wave (v) green would end wave c pink, and wave (2) black in its entirety.
At this stage the invalidation point remains the same. Any further extension of wave 4 purple may not move into wave 1 purple price territory. This wave count is invalidated with movement below 1,263.54.
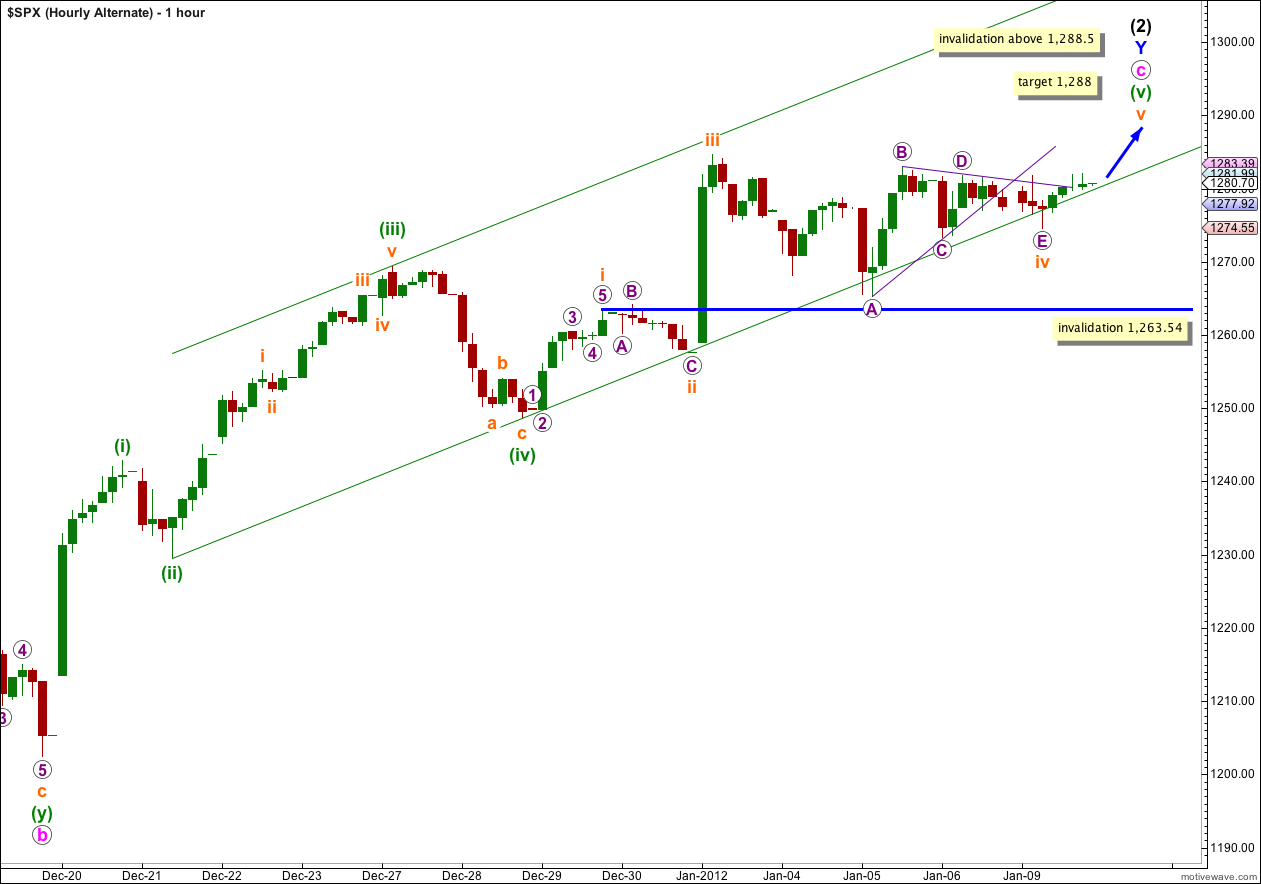
Alternate Hourly Wave Count.
This wave count remains valid for the S&P 500 but not the Dow after last week’s new high. Therefore, the probability for this wave count for the S&P 500 is significantly reduced.
For that reason I really do not want to consider it at this stage seriously. Only if it shows itself to be correct should we spend time on it.


