
Price moved a little lower, below the short term invalidation point on the hourly chart, before turning upwards again. Wave 4 remains above the price territory of wave 1 and I expect this downwards movement at the start of Thursday’s session was an unexpected extension of a fourth wave correction. The structure of the unfolding wave upwards remains valid.
Our expectations for price to continue upwards remain and the target remains the same. In terms of duration this upwards wave is taking longer than expected and use of the trend channels on hourly and daily charts may be the best guide to when this trend is over.
Click on the charts below to enlarge.
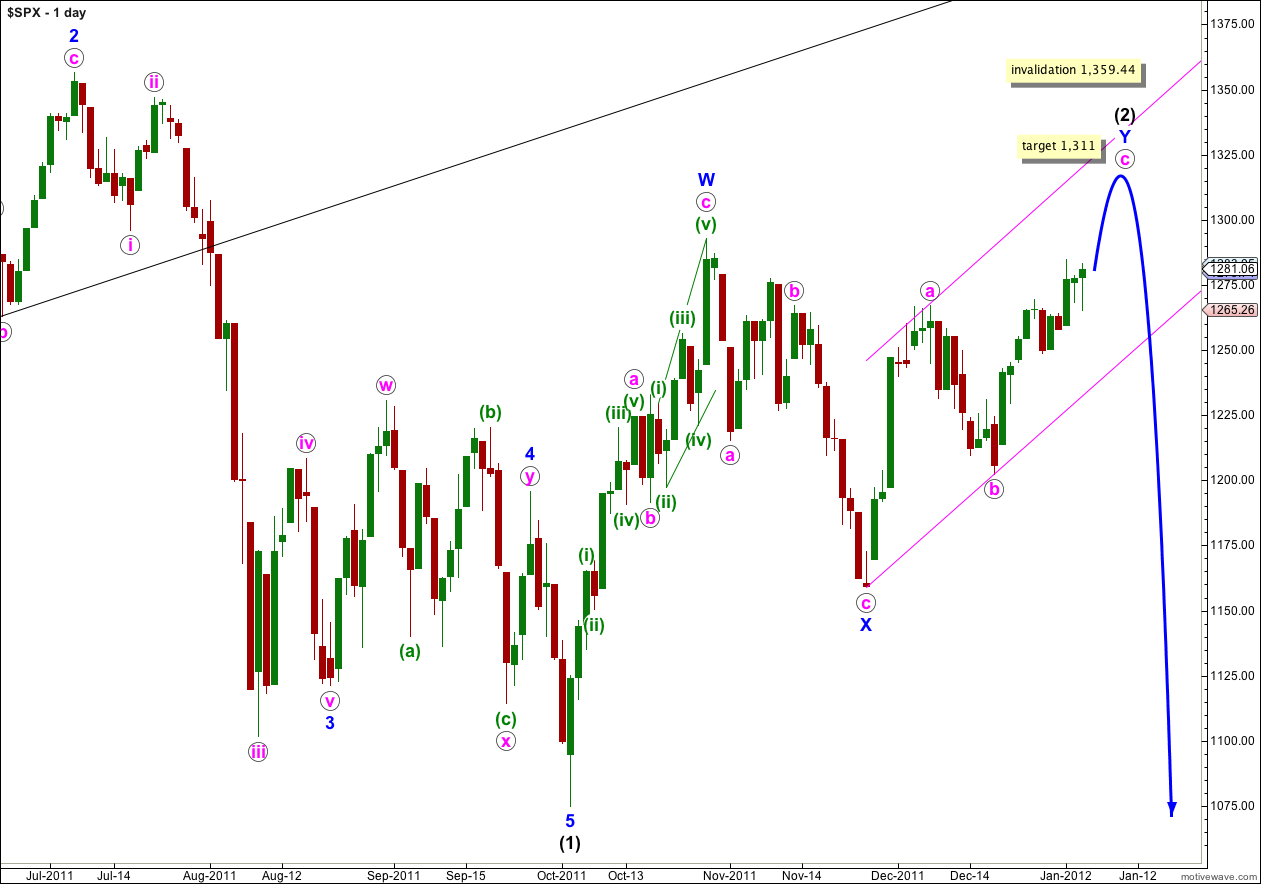
Wave c pink has now lasted 11 days. With the structure within wave c pink requiring further upwards movement, and expecting two larger fourth wave corrections yet along the way, it may take longer than another two sessions. Wave c pink may not have a Fibonacci time ratio when it is finished.
At 1,311 wave c pink would reach equality with wave a pink. This is a common ratio between a and c waves and is a likely target. This may bring price close to the upper edge of the pink parallel channel. When this channel is breached by downwards movement then we shall have confirmation of a trend change.
Wave (2) black is a double zigzag structure. The purpose of double zigzags is to deepen a correction, and the probability that price will make a new high above the high labeled W blue at 1,292.66 is very high. When the second zigzag in the double, wave Y blue, is complete then the probability that wave (2) black is over would be very high. Double zigzags and double combinations are relatively common structures, and triple zigzags are very rare.
Wave (2) black may not move beyond the start of wave (1) black. This wave count is invalidated with movement above 1,359.44.
Main Hourly Wave Count.
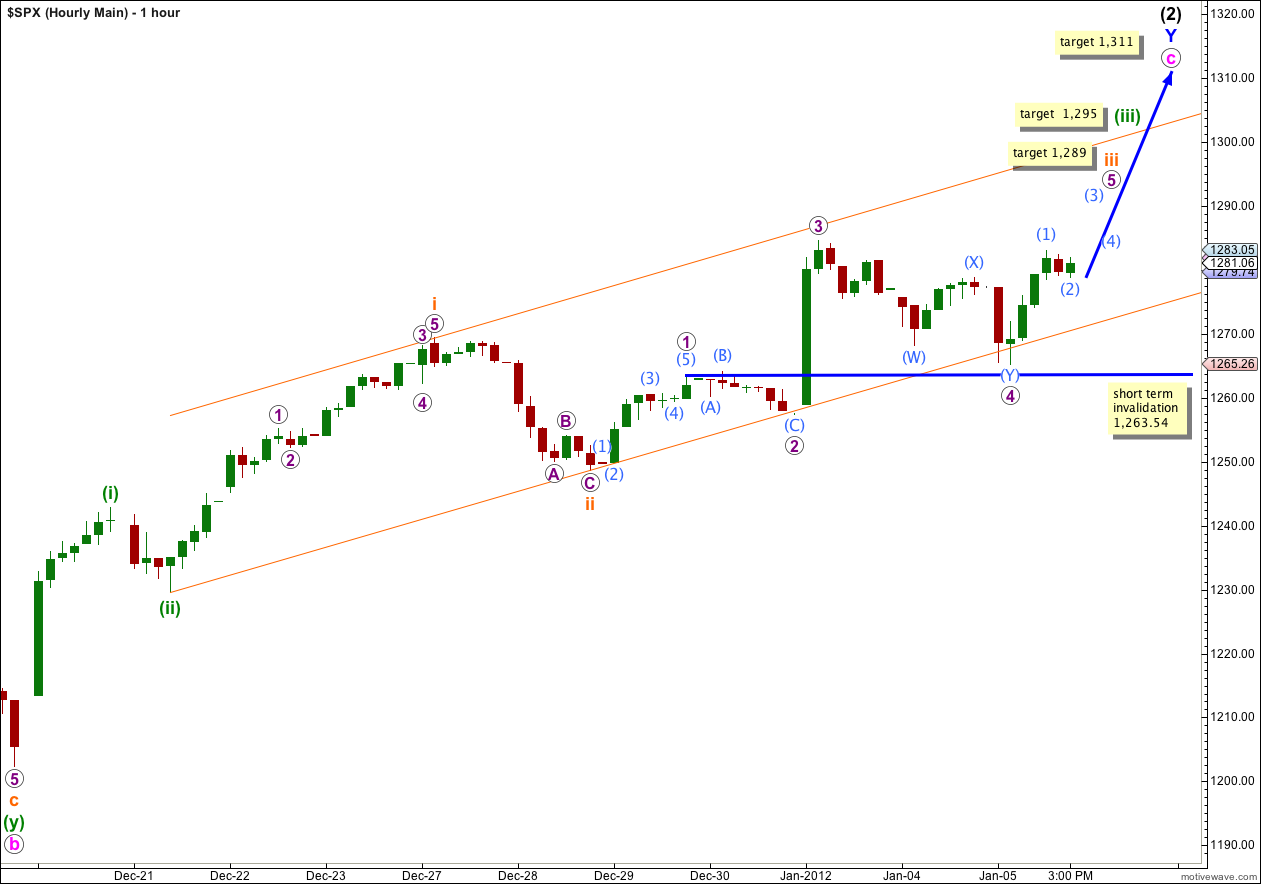
My confidence that wave 4 purple was complete yesterday was misplaced. It continued further sideways and lower as a double zigzag structure.
Wave 4 purple is now larger in duration than wave 2 purple, but they are still reasonably in proportion and the structure still looks reasonably typical. Wave 4 purple still exhibits excellent alternation with wave 2 purple as wave 2 was a shallow flat correction and wave 4 is a deep double correction.
Wave 5 purple is still incomplete. It is possible that it could be truncated and wave (1) aqua instead be labeled as a complete wave 5 purple, but this would leave almost no room for movement for wave iv orange. It is most likely that this was only wave (1) aqua within wave 5 purple.
At 1,289 wave 5 purple would reach 1.618 the length of wave 1 purple. This is a likely target for upwards movement for tomorrow’s session.
Thereafter, we must move the invalidation point up to the high of wave i orange at 1,269.37. The upcoming fourth wave correction, iv orange, may not move into wave i orange price territory.
To start tomorrow’s session we should not see movement below the start of wave 5 purple at 1,265.26. However, it is possible (but very unlikely) that wave 4 purple could continue yet further as a triple zigzag. If it did it may not move into wave 1 purple price territory. This wave count is invalidated with movement below 1,263.54.
Alternate Hourly Wave Count.
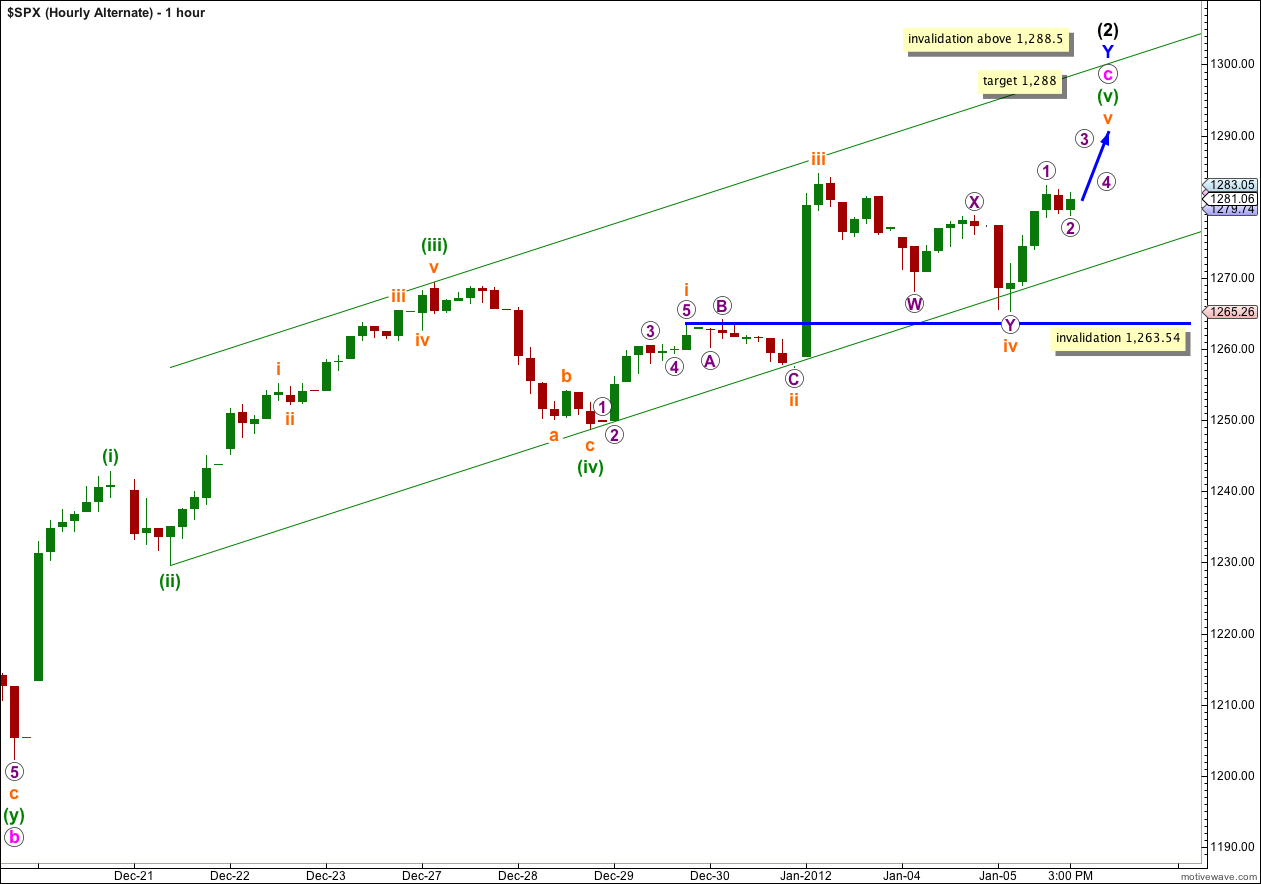
Wave iv orange remains outside of wave i orange price territory and this structure remains valid.
For this alternate wave count it is more possible that upwards movement could be over. Wave v orange may yet require further upwards movement, and this is most likely. However, the last wave up labeled 1 purple is a complete five wave impulse and this could be wave v orange in its entirety, and slightly truncated. Because the probability of a truncation is lower I have labeled it as likely to continue higher.
This wave count could see only one or two more sessions of upwards movement before a big trend change.
If price moves below 1,263.54 tomorrow then it may be likely that wave v orange is complete, which completes wave (2) black at all degrees. Movement below 1,263.54 would be an early indication that we may have seen a major trend change.