
Price has ended close to where it opened for Wednesday’s session. Downwards movement was allowed for and has remained above our invalidation point. So far this upwards wave is unfolding mostly as expected and it seems likely that our target will be reached. We should continue to use the parallel channel on the hourly chart as price remains nicely contained within it, and we may use Elliott’s technique to redraw the channel after or during tomorrow’s session.
In the mid term the parallel channel on the daily chart should provide some guidance to where upwards movement may end, and when this channel is breached by downwards movement we shall have confirmation of a trend change.
Both our main and alternate hourly wave counts remain valid.
Click on the charts to enlarge.
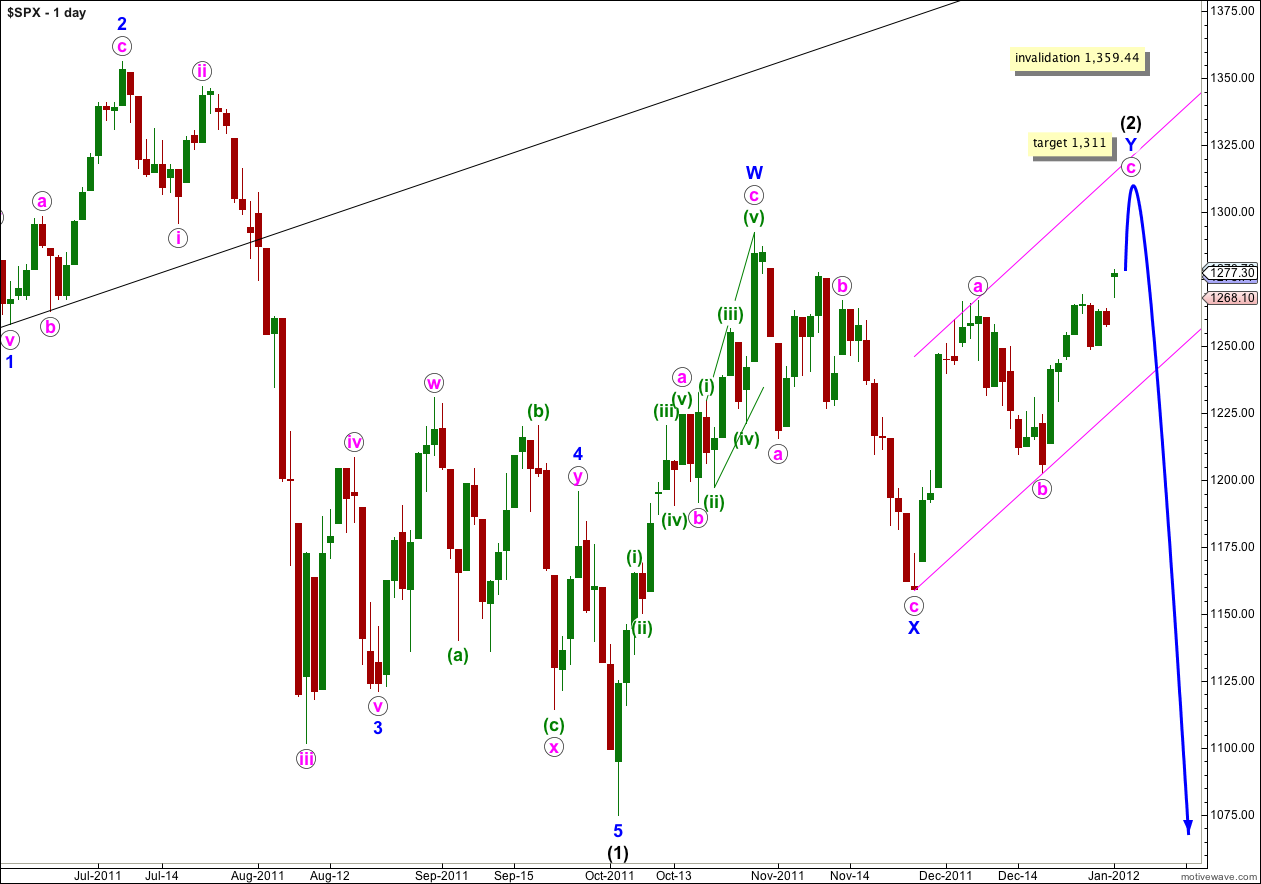
Wave c pink is unfolding most likely with an extended third wave within it, which remains valid. If this is correct we should see a continuation of upwards movement most likely towards our target at 1,311 where wave c pink would reach equality with wave a pink.
The normal purpose of a double zigzag, which is the structure of wave (2) black, is to deepen a correction. This means the probability that price will make a new high above W blue at 1,292.66 is fairly high.
Waves a and b pink lasted a Fibonacci 8 days. Wave c pink has now exceeded a Fibonacci 8 days. If it is to have a Fibonacci relationship it may end on Monday the 9th of January, lasting a Fibonacci 13 days. Waves sometimes have Fibonacci time relationships, but this is not common enough to be reliable. Therefore, please take this possible end date as a rough guide only as price is a more reliable guide than time.
We may use Elliott’s channeling technique about the zigzag of wave Y blue to tell us where wave c pink may end. C waves often end about the upper edge of these parallel channels. When the channel is breached by downwards movement then we shall have confirmation of a trend change.
Wave (2) black may not move beyond the start of wave (1) black. This wave count is invalidated with movement above 1,359.44.
Main Hourly Wave Count.
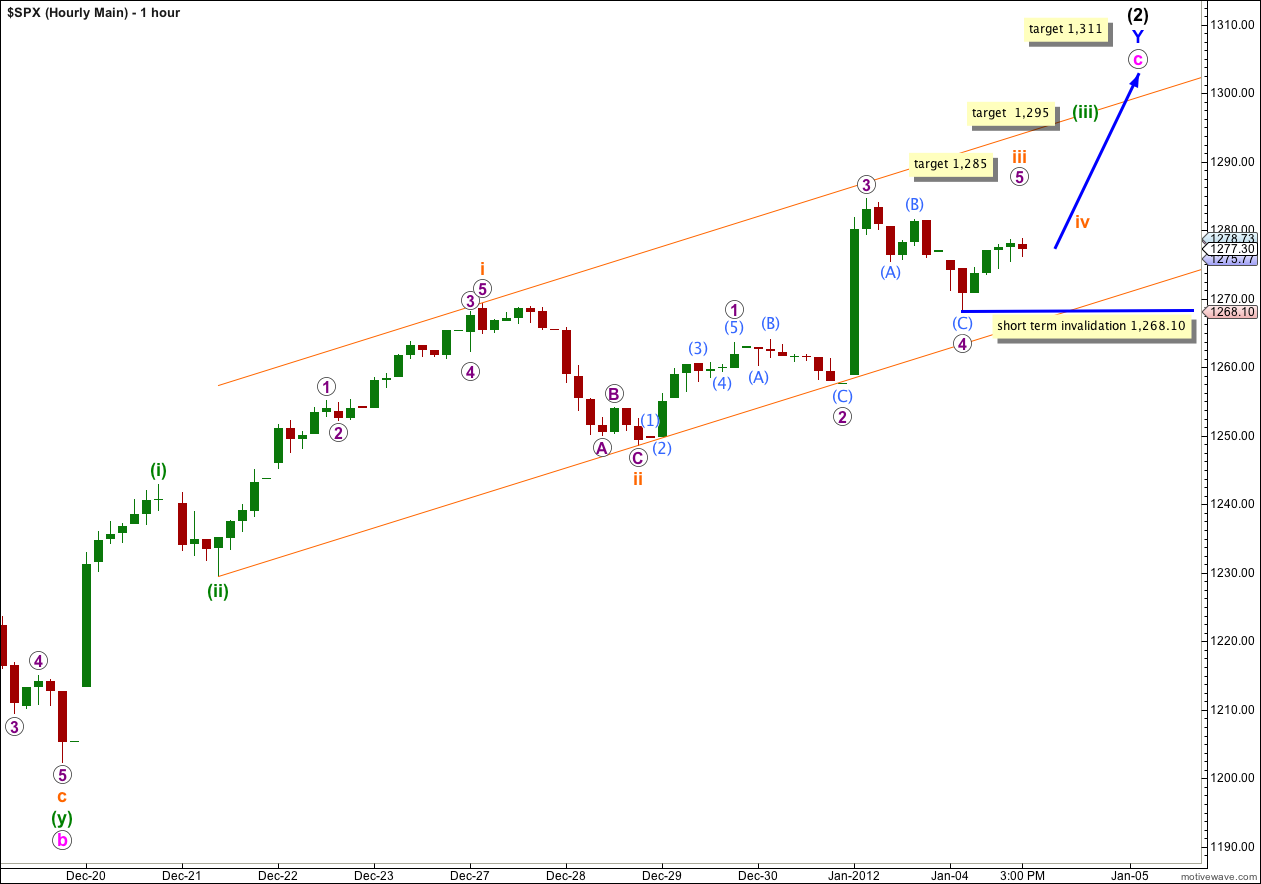
Wave 4 purple within the extension of wave (iii) green has moved lower, and remains above the price territory of wave 1 purple.
Wave 2 purple was a flat correction and a shallow 41% correction of wave 1 purple. Wave 4 purple is now an obvious zigzag and a deep 61% correction of wave 3 purple. We have seen perfect alternation within wave iii orange.
If wave 5 purple were to reach equality with wave 1 purple it would be truncated. It is more likely to not be truncated and the next calculated target at 1,285 is were wave 5 purple would reach 0.618 the length of wave 3 purple. At this stage I am more confident that wave 4 purple is complete; it is in proportion to wave 2 purple and a clear three wave structure.
Within wave 5 purple no second wave correction may move beyond the start of it’s first wave. This wave count is invalidated in the short term with movement below 1,268.10.
It is likely price will continue upwards tomorrow to a new high.
When wave iii orange is complete the invalidation point must move up to the high of wave i orange at 1,269.37. We should expect a longer lasting correction for wave iv orange to be a shallow flat, triangle or combination.
When wave iii orange is complete we may redraw the parallel channel. Draw the first trend line from the highs of i to iii orange, and place a parallel copy on the low of ii orange. Expect wave iv orange to find support at the lower edge of this channel, if it gets down that far (it may not). The following fifth wave upwards may find resistance at the upper edge of the channel.
At 1,295 wave (iii) green would reach 1.618 the length of wave (i) green. When wave iv orange within wave (iii) green is complete this target may be recalculated.
Alternate Hourly Wave Count.
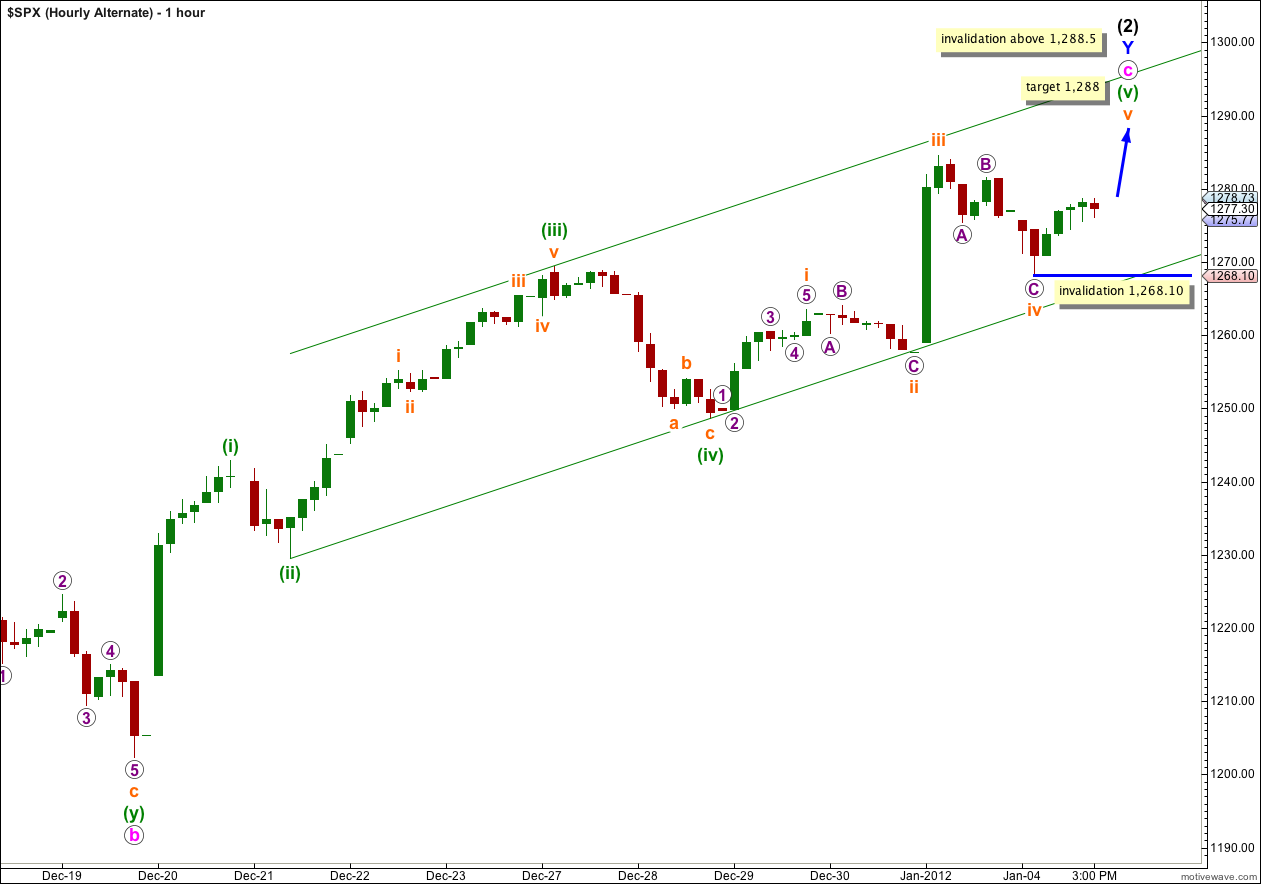
This wave count remains valid.
Wave (iii) green is 0.59 points short of equality with wave (i) green. Wave (v) green is therefore limited to no longer than equality with wave (iii) green because the third wave can never be the shortest. This gives us a maximum limit to upwards movement for this wave count to no higher than 1,288.50.
At 1,288 wave (v) green would reach almost equality with wave (iii) green.
On the 5 minute chart wave v orange is an incomplete structure. This wave count expects further upwards movement.
If this wave count is correct then upwards movement could end tomorrow. If we see a little further upwards movement, then price turns down and moves below 1,268.10 this wave count may provide a valid explanation. Wave v orange does not have to make a new high above the end of wave iii orange at 1,284.62, but it is more likely that it would.