
Elliott Wave chart analysis for the S&P 500 for 3rd January, 2012. Please click on the charts below to enlarge.

Movement above 1,269.37 indicated our alternate hourly wave count was correct and we should expect more upwards movement. Movement above 1,277.55 invalidated our alternate daily wave count leaving us with only this one wave count. We have further clarity now, and with all alternate daily charts invalidated we may have more confidence that wave (2) black is coming to an end and when it is done wave (3) black within primary wave 3 should begin.
The structure and overall look developing on the hourly chart indicates that within wave c pink the third wave is extending. This is also very common for third waves. This allows for further upwards movement and we will revert to our original target for wave c pink to reach equality with wave a pink at 1,311. This would also allow for the double zigzag of wave (2) black to achieve its purpose, to deepen the correction beyond the high of wave W blue at 1,292.66, giving wave (2) black a typical look and behaviour.
Waves a and b pink lasted a Fibonacci 8 days. Wave c pink has now exceeded a Fibonacci 8 days. If it is to have a Fibonacci relationship it may end on Monday the 9th of January, lasting a Fibonacci 13 days. Waves sometimes have Fibonacci time relationships, but this is not common enough to be reliable. Therefore, please take this possible end date as a rough guide only as price ratios are more reliable than Fibonacci time relationships.
We may use Elliott’s channeling technique about the zigzag of wave Y blue to tell us where wave c pink may end. C waves often end about the upper edge of these parallel channels. When the channel is breached by downwards movement then we shall have confirmation of a trend change.
Wave (2) black may not move beyond the start of wave (1) black. This wave count is invalidated with movement above 1,359.44.
Main Hourly Wave Count.
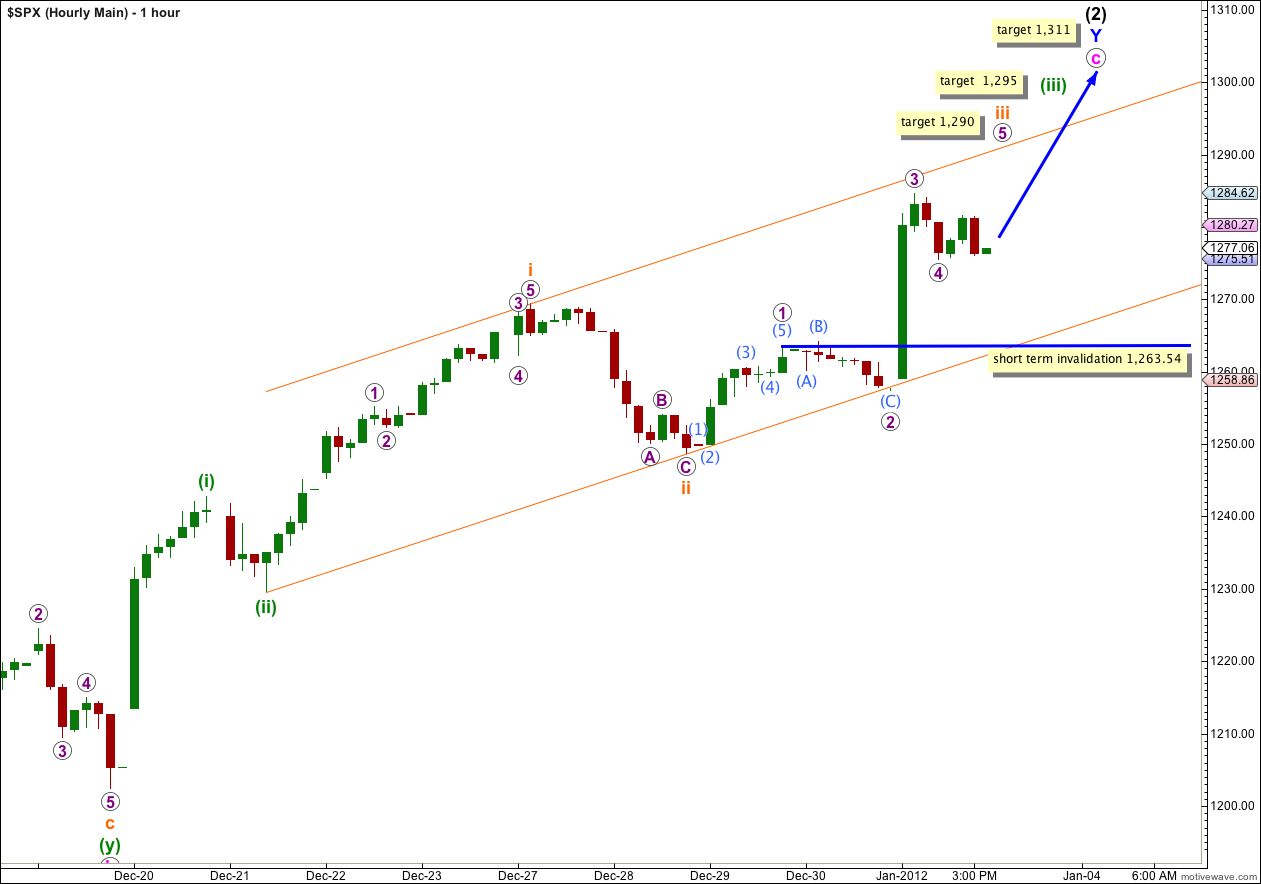
Upwards movement has a typical look of an extending third wave. This wave count has the best look and it has a higher probability than the alternate below.
Within wave (iii) green only wave i orange is complete. The middle of wave (iii) green, wave iii orange, is extending.
Wave 3 purple has no Fibonacci ratio to wave 1 purple. This means it is more likely that wave 5 purple will exhibit a Fibonacci ratio to either of 1 or 3 purple. The most common and most likely relationship is equality with wave 1 purple which was 14.9 points in length. If wave 4 purple is complete at 1,275.46 then wave 5 purple may end at 1,290. If wave 4 purple moves lower the target must be adjusted.
In the short term within wave iii orange wave 4 purple may not move into wave 1 purple price territory. This wave count is invalidated with movement below 1,263.54.
At 1,295 wave (iii) green would reach 1.618 the length of wave (i) green. This target should be reached this week.
At 1,311 wave c pink would reach equality in length with wave a pink. This target may be reached next Monday.
If this wave count is correct then I would expect upwards movement to breach the parallel channel as it is drawn here.
Alternate Hourly Wave Count.
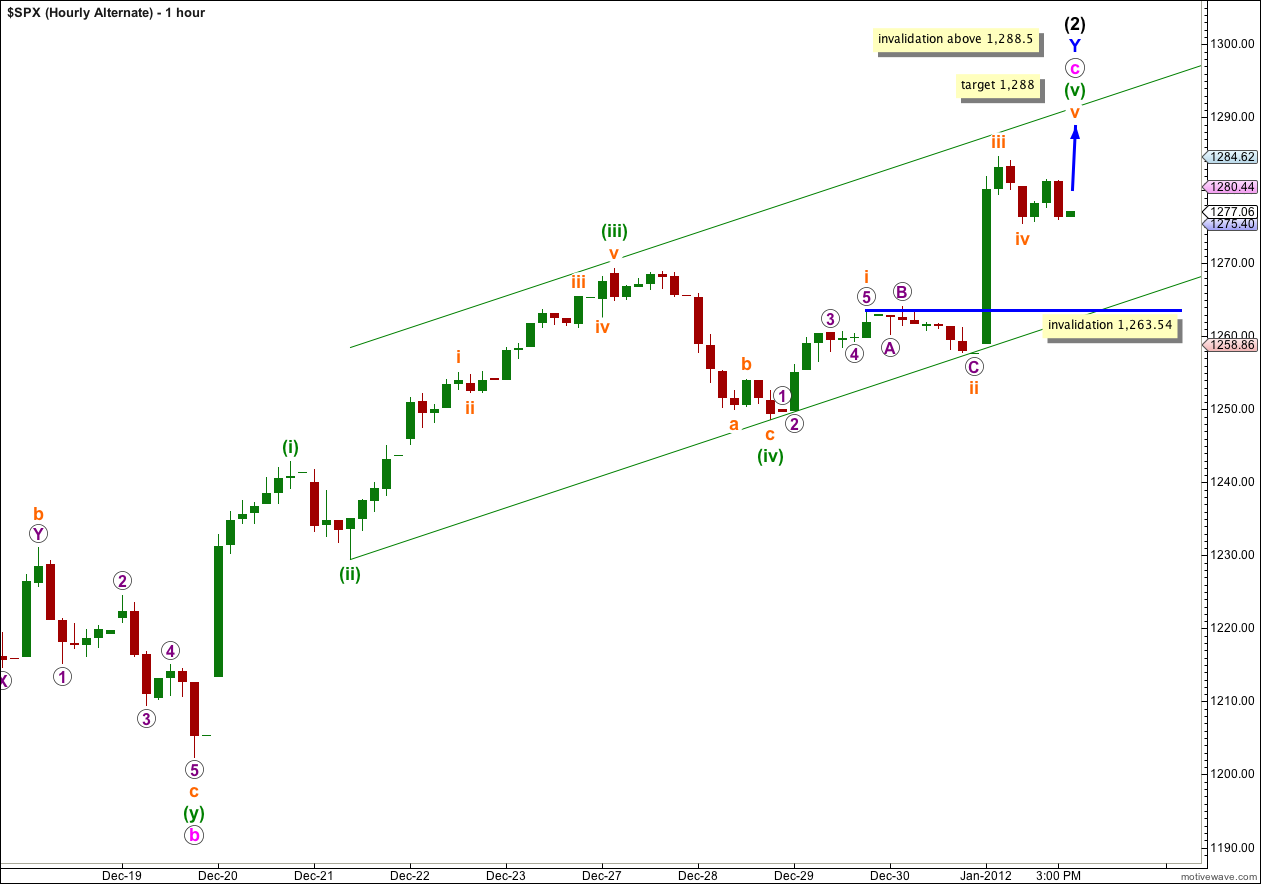
This wave count follows on directly from our previous wave count. At this stage it is now starting to not have a typical look.
If waves (i), (ii), (iii) and (iv) green are all complete then wave (v) green has a maximum limit and it cannot be longer than equality with wave (iii) green because wave (iii) green was 0.59 points shorter than equality with wave (i) green.
At 1,288.50 wave (v) green would reach equality with wave (iii) green. We may expect it to end about this point, but not above.
Movement above 1,288.50 would confirm our main hourly wave count.