
Elliott Wave chart analysis for the S&P 500 for 30th December, 2011. Please click on the charts below to enlarge.
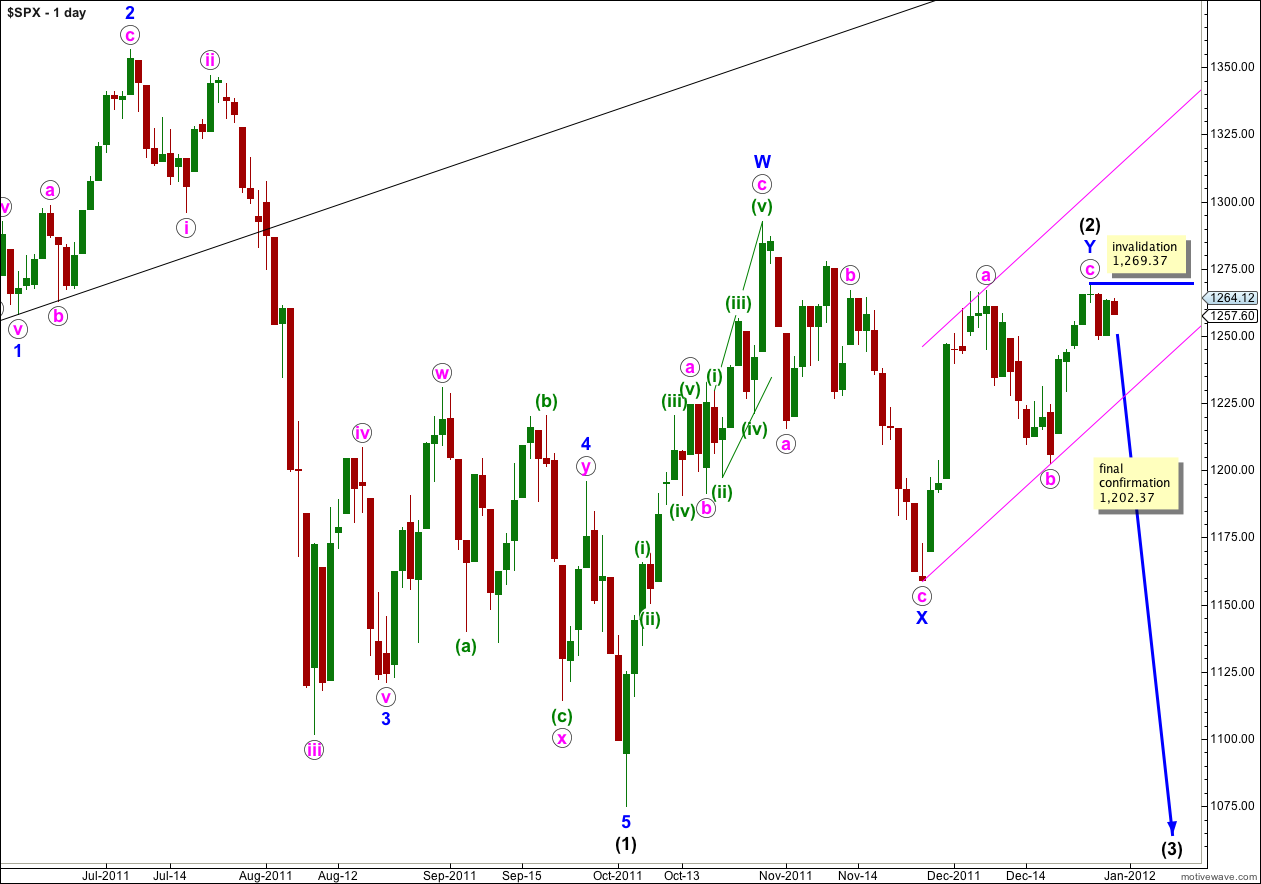
Friday’s session moved price slowly lower, which was not what we had expected. Wave (2) black may have ended on Tuesday, with wave c pink lasting a Fibonacci 5 days, or it may not yet be over and wave c pink may last another 5 days to make a total of a Fibonacci 13.
We may use confirmation and invalidation points to indicate a trend change, along with trend channels.
At this stage we have no confirmation of a trend change.
The structure of recent movement on the hourly chart indicates that it is more likely that wave (2) black is complete. So far downwards movement from Tuedsay’s high is in a five wave movement, and following upwards movement is in a three. If this is correct then we should see an increase in downwards momentum over the next few trading days of the new year.
Initial confirmation of a trend change will come with price movement below 1,248.75. Further confirmation will come with price movement below the parallel channel here on the daily chart. Final confirmation will come with movement below 1,202.37.
Within wave (3) black no second wave correction may move beyond the start of the first wave. This wave count is invalidated with movement above 1,269.37. If this wave count is invalidated with upwards movement we may use the alternate hourly wave count below.
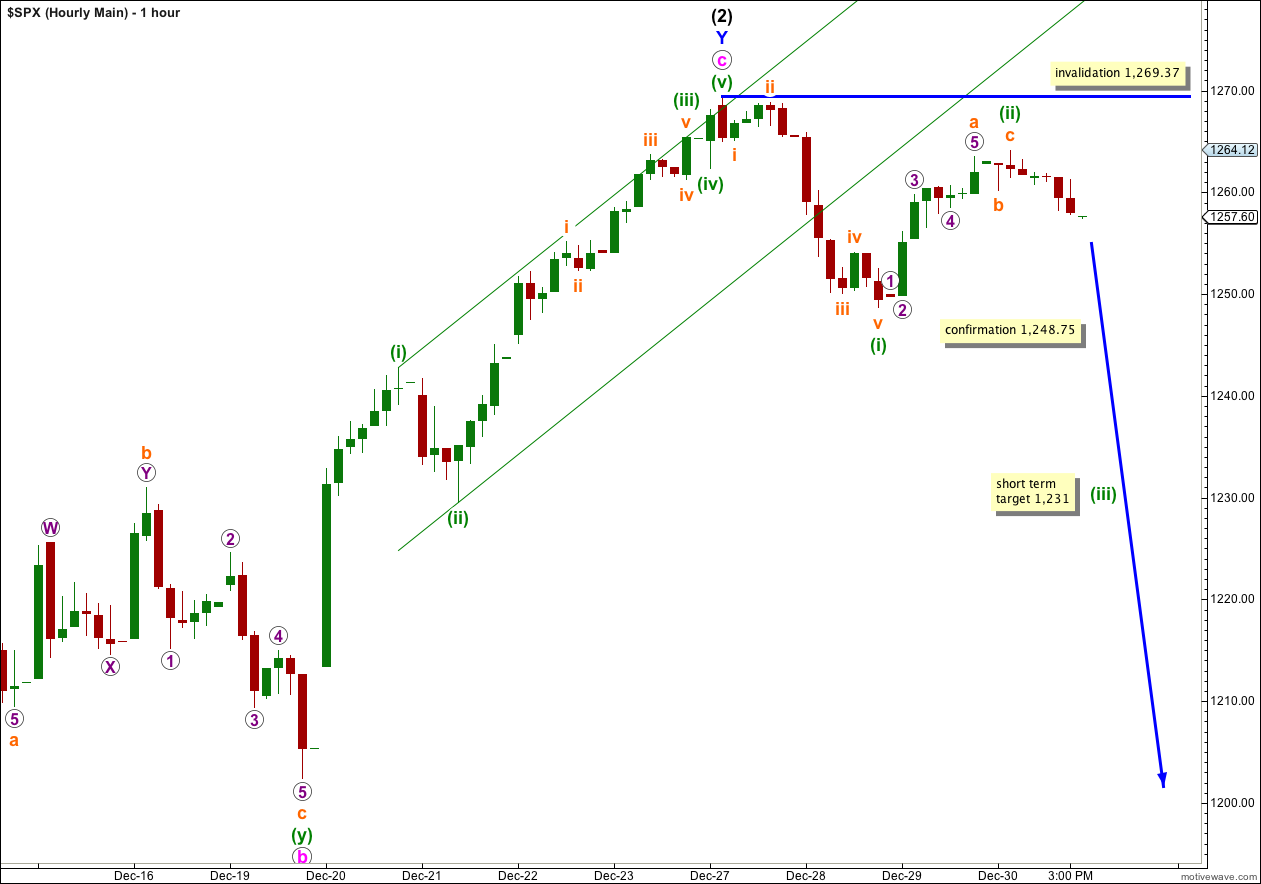
Because downwards movement labeled (i) green looks very much like a five wave structure, and the following upwards movement labeled (ii) green remains most like a three wave structure which did not develop further into a five, this is my main hourly wave count.
It looks like wave c pink may have lasted only a Fibonacci 5 days and was over on Tuesday 27th December. Wave c pink was almost exactly 0.618 the length of wave a pink, just 0.01 longer.
Within wave c pink there are no Fibonacci ratios between waves (i), (iii) and (v) green.
If this wave count is correct then we should see an increase in downwards movement when markets open next week.
Wave (3) black must take price to new lows below the end of wave (1) black at 1,074.77.
When this very large trend change is confirmed then I will calculate targets for wave (3) black. It would be premature to do at this stage.
The very first indication that we may have had this trend change would be a breach of the parallel channel here on the hourly chart. Movement below 1,248.75 would invalidate the alternate hourly count below, providing further initial confirmation of the trend change.
At 1,231 wave (iii) green would reach 1.618 the length of wave (i) green.
Any further continuation of wave (ii) green upwards may not move beyond the start of wave (i) green. This wave count is invalidated with movement above 1,269.37.
Alternate Hourly Wave Count.
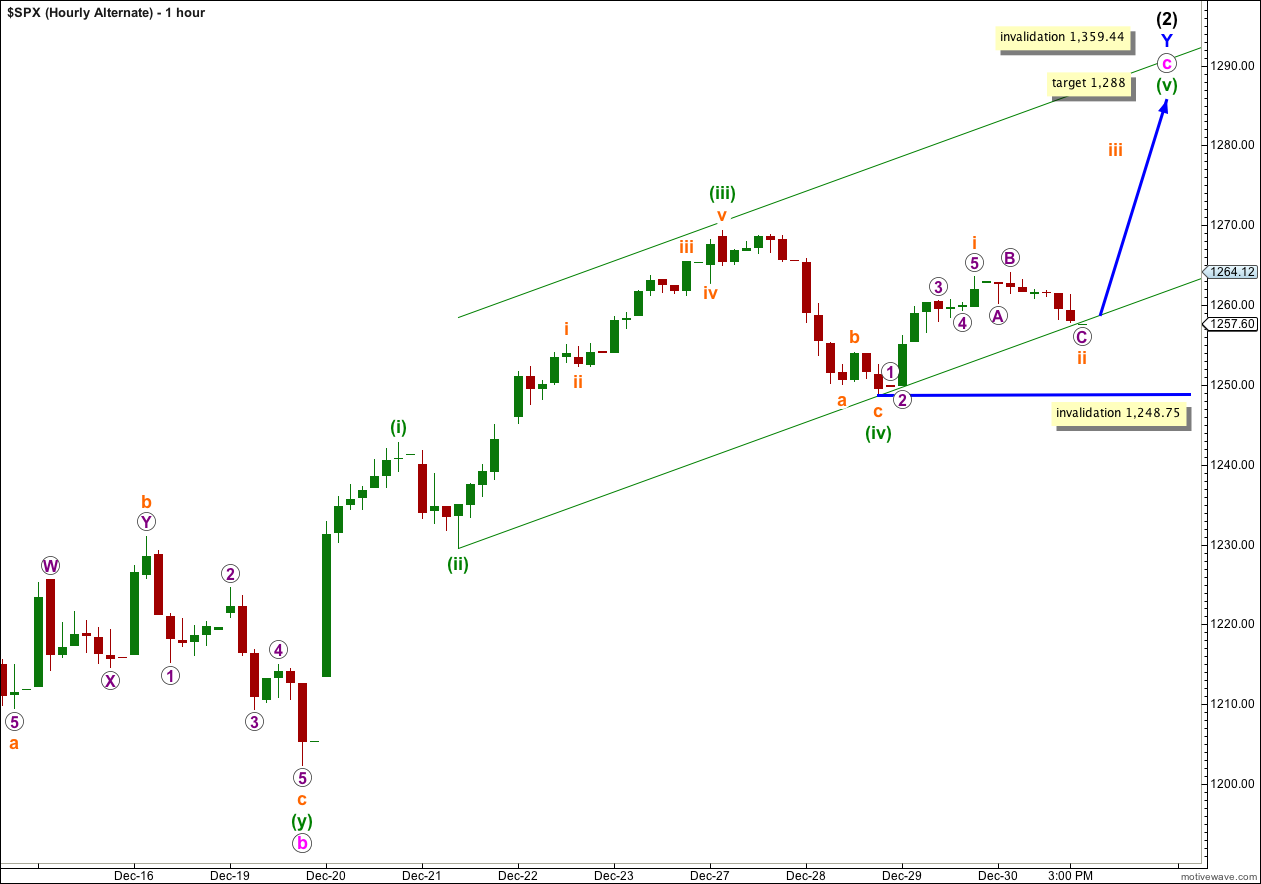
This wave count does not have as good a fit as the main hourly wave count for recent movement.
It is possible to see downwards movement labeled (iv) green as a three wave structure, this movement is a little ambiguous, but this seems to be stretching credulity a little.
At 1,288 wave (v) green would reach equality with wave (iii) green. This is also the maximum limit to upwards movement because wave (iii) green is slightly shorter than wave (i) green.
If this wave count is correct then wave ii orange may not move beyond the start of wave i orange. This wave count is invalidated with movement below 1,248.75.
Alternate Daily Wave Count.
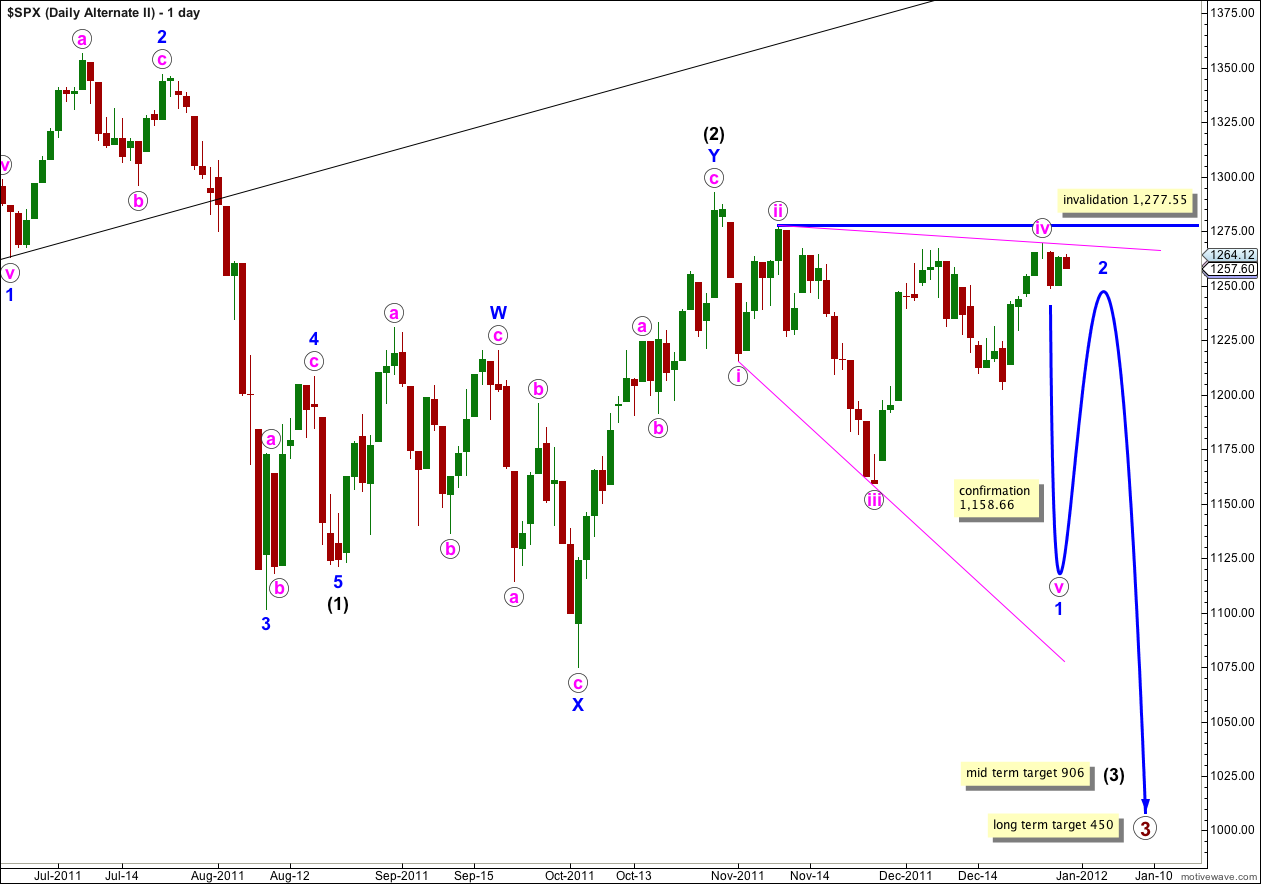
There are three reasons why I consider this wave count to have a very low probability:
1. Wave iv pink is already deeper than 0.81 of wave iii pink; this is the maximum common length for wave 4 within a diagonal in relation to wave 3.
2. While leading diagonals are not uncommon, leading expanding diagonals are supposedly less common structures.
3. A similar wave count on the Dow is invalidated; the Dow and S&P 500 have been moving together nicely for some time and it would be highly unusual for them to now diverge.
Within the leading diagonal for wave 1 blue wave iv pink may not move beyond the end of wave ii pink. This wave count is invalidated with movement above 1,277.55.
A leading diagonal may not have a truncated fifth wave. This wave count requires movement below 1,158.66 to remain valid.