
Elliott Wave chart analysis for the S&P 500 for 21st December, 2011. Please click on the charts below to enlarge.
As expected from last analysis the S&P 500 has moved overall higher during Wednesday’s session, to make a slight new high.
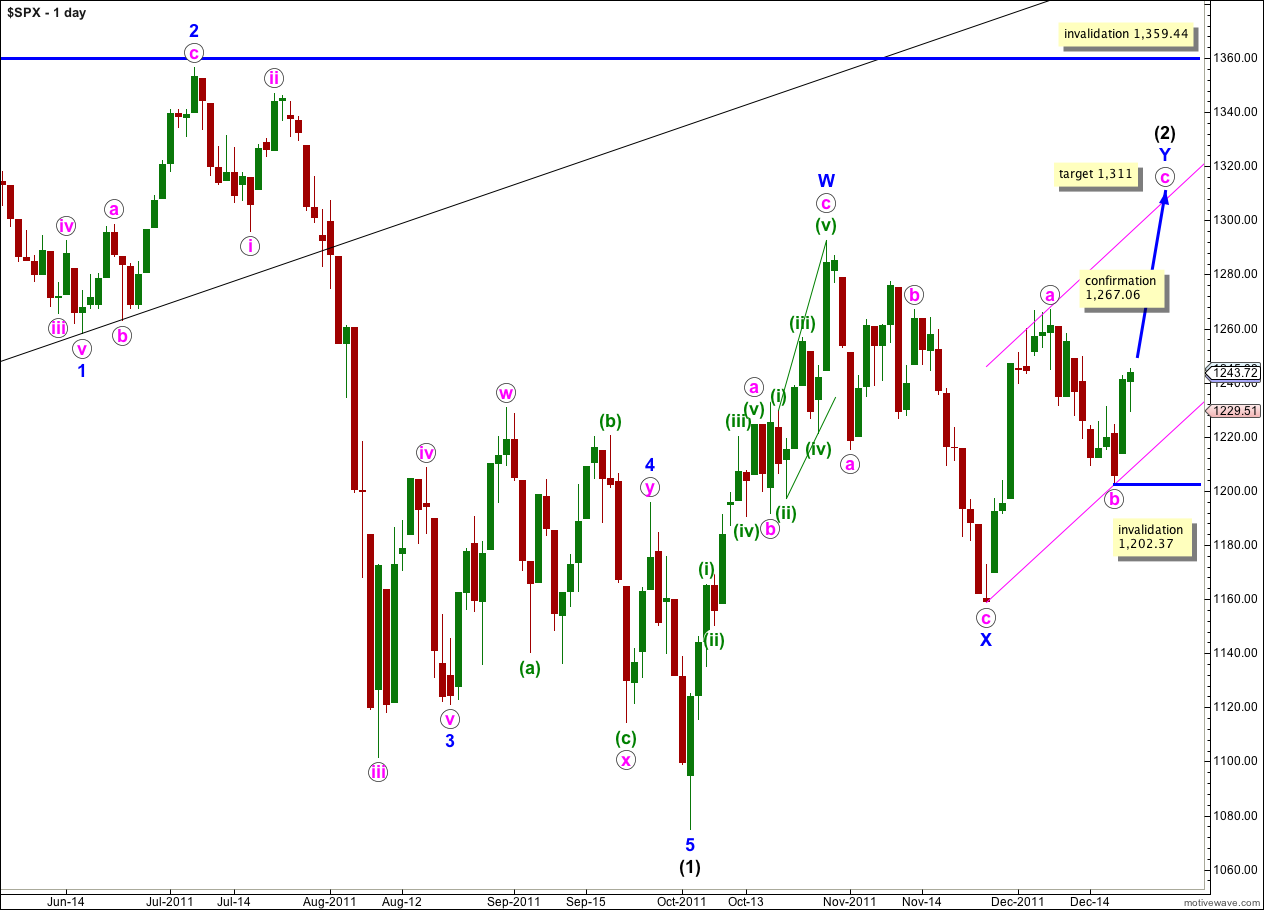
Wave c pink is highly likely to take price to a new high above the end of wave a pink at 1,267.06 to avoid a truncation. Wave Y blue is highly likely to take price to a new high above the end of wave W blue at 1,292.66 to achieve the purpose of a double zigzag, which is to deepen a correction.
At 1,311 wave c pink would reach equality in length with wave a pink. This is the most likely target for upwards movement to end.
We may draw a parallel channel about the zigzag for wave Y blue. Wave c pink may end about the upper edge of the channel, or with a small overshoot.
Movement above 1,267.06 would confirm this wave count at intermediate (black) degree because at the point our first alternate wave count would be invalidated.
Within wave c pink no second wave correction may move beyond the start of its first wave. This wave count is invalidated with movement below 1,202.37.
Wave (2) black may not move beyond the start of wave (1) black. This wave count is invalidated with movement above 1,359.44.
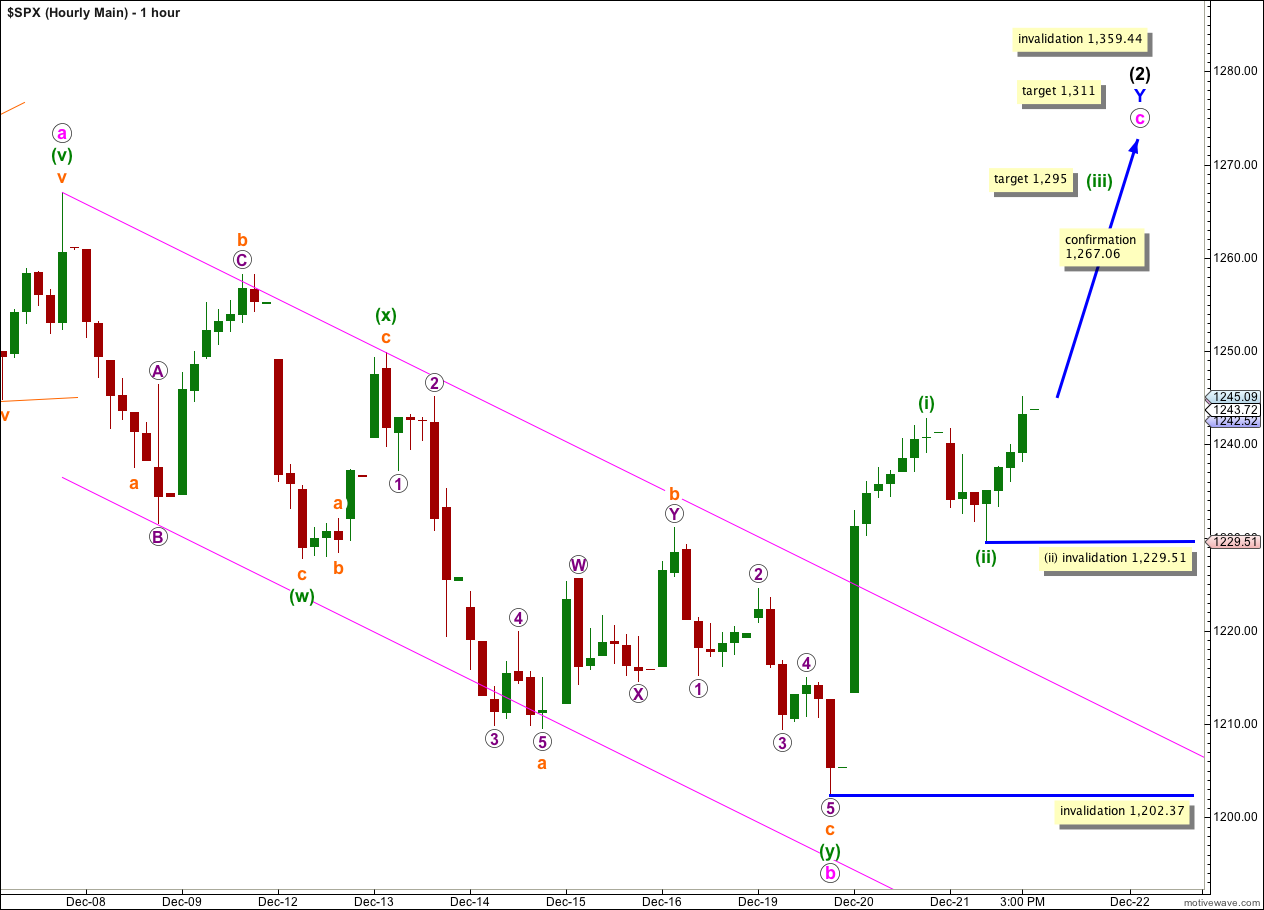
The session began with some downwards movement. This was most likely wave (ii) green which was very slightly more than 0.382 the length of wave (i) green.
Wave (iii) green has most likely begun. The structure on the 5 minute chart looks like the very middle of it has possibly ended. Wave iv orange within it may not move into wave i orange within (iii) green (seen on the 5 minute chart below) and in the very short term we should not see price move below 1,236.78.
Wave (iii) green would reach 1.618 the length of wave (i) green at 1,295. When wave (iii) green is a complete five wave structure then we may expect wave (iv) green to be a relatively deep correction of wave (iii) green, to about the 0.618 Fibonacci level. At that stage we may move the invalidation point up to the high of wave (i) green at 1,242.82.
If wave (ii) green is over (and it is most likely that this is the case) then within wave (iii) green no second wave correction may move beyond the start of the first wave. Movement below 1,229.51 would invalidate the labeling of wave (ii) green as complete.
Upwards movement for wave (iii) green on the 5 minute chart looks very much like a third wave, and not a B wave, and it is very likely that wave (ii) green is complete and the first invalidation point will not be breached.
If price moves below 1,229.51 then wave (ii) green would be continuing further as a large flat or double combination correction. The invalidation point would move back down to 1,202.37. Wave (ii) green may not move beyond the start of wave (i) green.
At 1,311 wave c pink would reach equality in length with wave a pink. This target may be reached about 30th December, 2011.
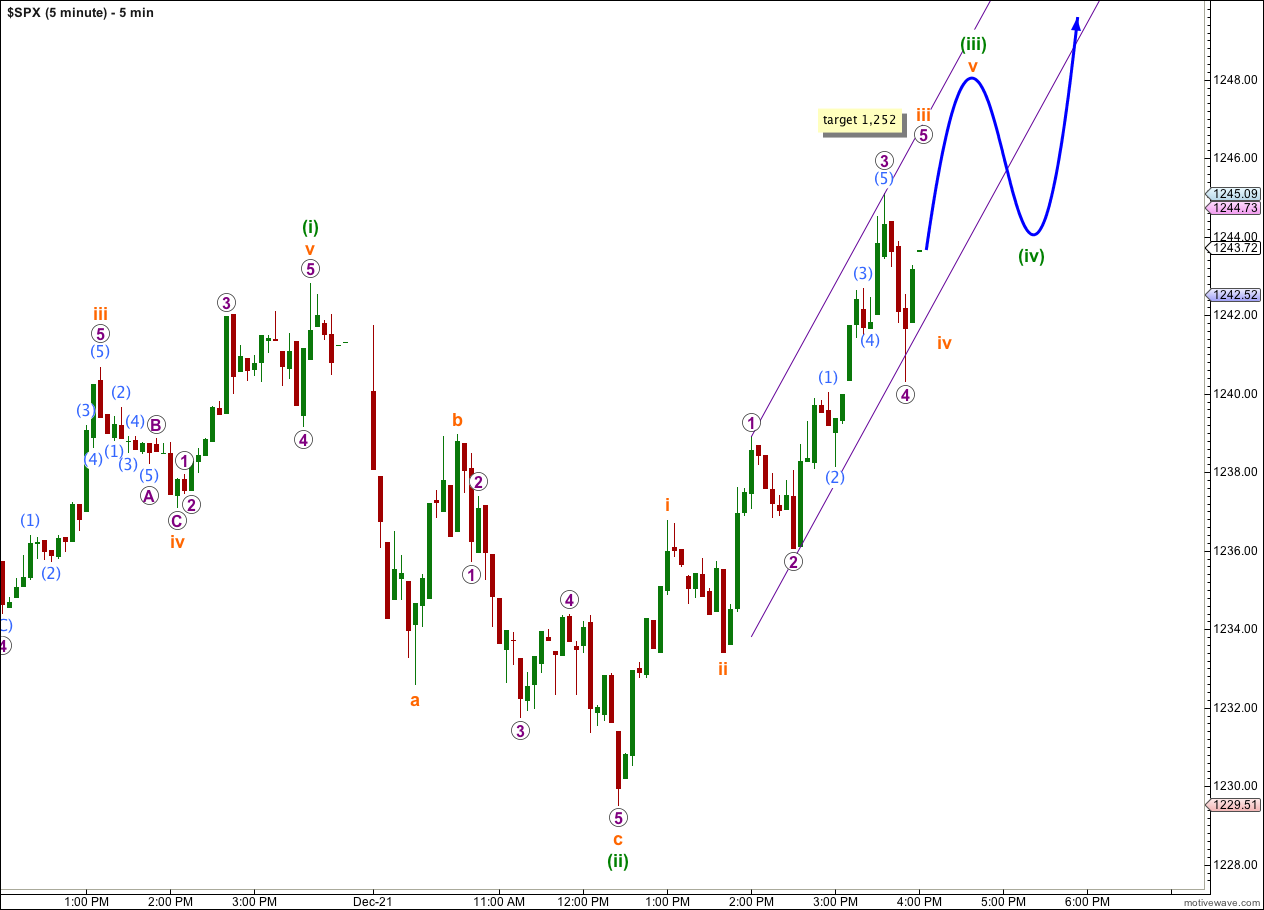
Upwards movement for (iii) green looks typically impulsive. The middle of this third wave, wave 3 purple, is probably over and is just 0.08 points longer than wave 1 purple.
My only concern for this analysis of the 5 minute chart is the structure of wave (ii) green. At first glance it looks like a five wave structure, but wave 4 would overlap wave 1. If that was a five down then the three up should not have made a new high above 1,242.85. Movement to a new high invalidates a five down wave count, and a three does also fit.
When wave (iii) green is complete we should draw a parallel channel about wave c pink. Draw the first trend line from the high of (i) green to the high of (iii) green, then place a parallel copy on the low of (ii) green. Wave (iv) green is likely to end about the lower edge of this parallel channel.
Alternate Wave Count.
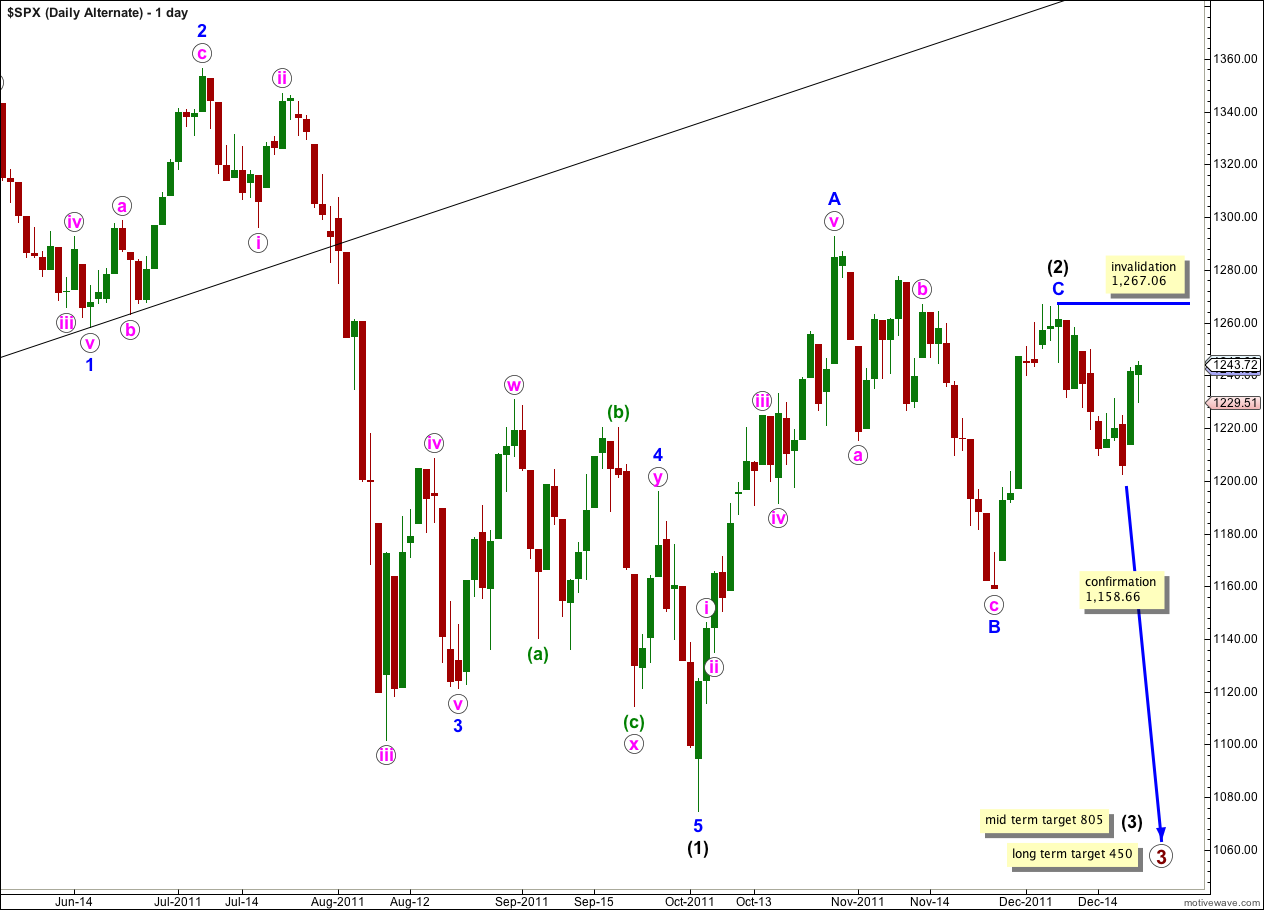
This wave count has a low probability because wave C blue within the zigzag for wave (2) black is severely truncated. However, the subdivisions fit.
Only if we saw very strong downwards movement from this point below 1,158.66 would we need to use this wave count. At that stage it would provide a valid explanation.
Within wave (3) black no second wave correction may move beyond the start of the first wave. This wave count is invalidated with movement above 1,267.06. If this wave count is invalidated by upwards movement then our main wave count could be considered confirmed.
Second Alternate Wave Count.
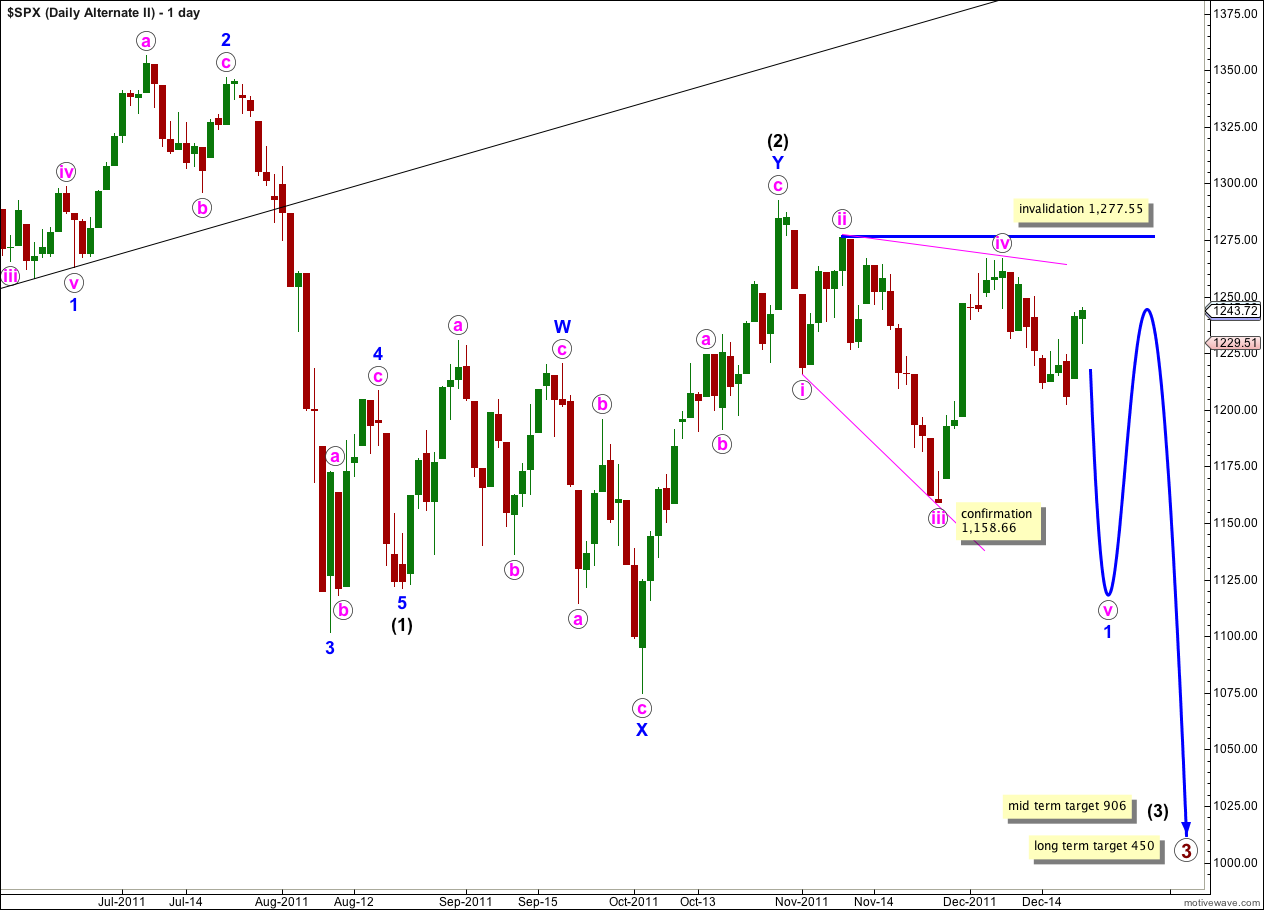
There are four reasons why I consider this wave count to have the lowest probability:
1. Wave iv pink is not an obvious zigzag and it should be.
2. Wave iv pink is already deeper than 0.81 of wave iii pink; this is the maximum common length for wave 4 within a diagonal in relation to wave 3.
3. While leading diagonals are not uncommon, leading expanding diagonals are supposedly less common structures.
4. A similar wave count on the Dow is invalidated; the Dow and S&P 500 have been moving together nicely for some time and it would be highly unusual for them to now diverge.
Within the leading diagonal for wave 1 blue wave iv pink may not move beyond the end of wave ii pink. This wave count is invalidated with movement above 1,277.55.
A leading diagonal may not have a truncated fifth wave. This wave count requires movement below 1,158.66 to remain valid.