
Elliott Wave chart analysis for the S&P 500 for 20th December, 2011. Please click on the charts below to enlarge.
As expected from yesterday’s analysis the S&P 500 moved higher during Tuesday’s session, giving us confirmation of a trend change within the first hour of trading. We should expect to see upwards movement continue for probably another 7 trading days, ending on 30th December.
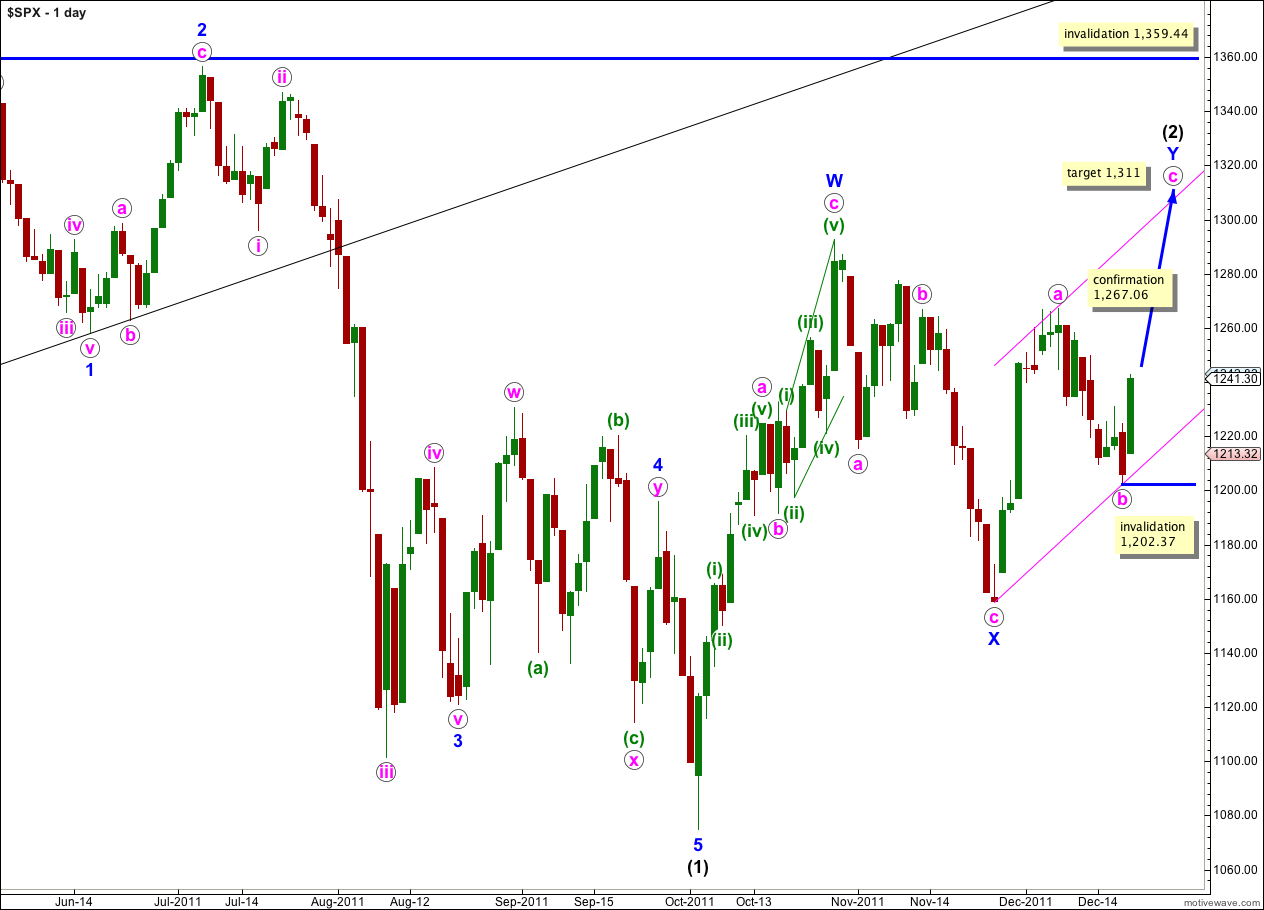
Wave c pink is highly likely to take price to a new high above the end of wave a pink at 1,267.06 to avoid a truncation. Wave Y blue is highly likely to take price to a new high above the end of wave W blue at 1,292.66 to achieve the purpose of a double zigzag, which is to deepen a correction.
At 1,311 wave c pink would reach equality in length with wave a pink. This is the most likely target for upwards movement to end.
We may draw a parallel channel about the zigzag for wave Y blue. Wave c pink may end about the upper edge of the channel, or with a small overshoot.
Movement above 1,267.06 would confirm this wave count at intermediate (black) degree because at the point our first alternate wave count would be invalidated.
Within wave c pink no second wave correction may move beyond the start of its first wave. This wave count is invalidated with movement below 1,202.37.
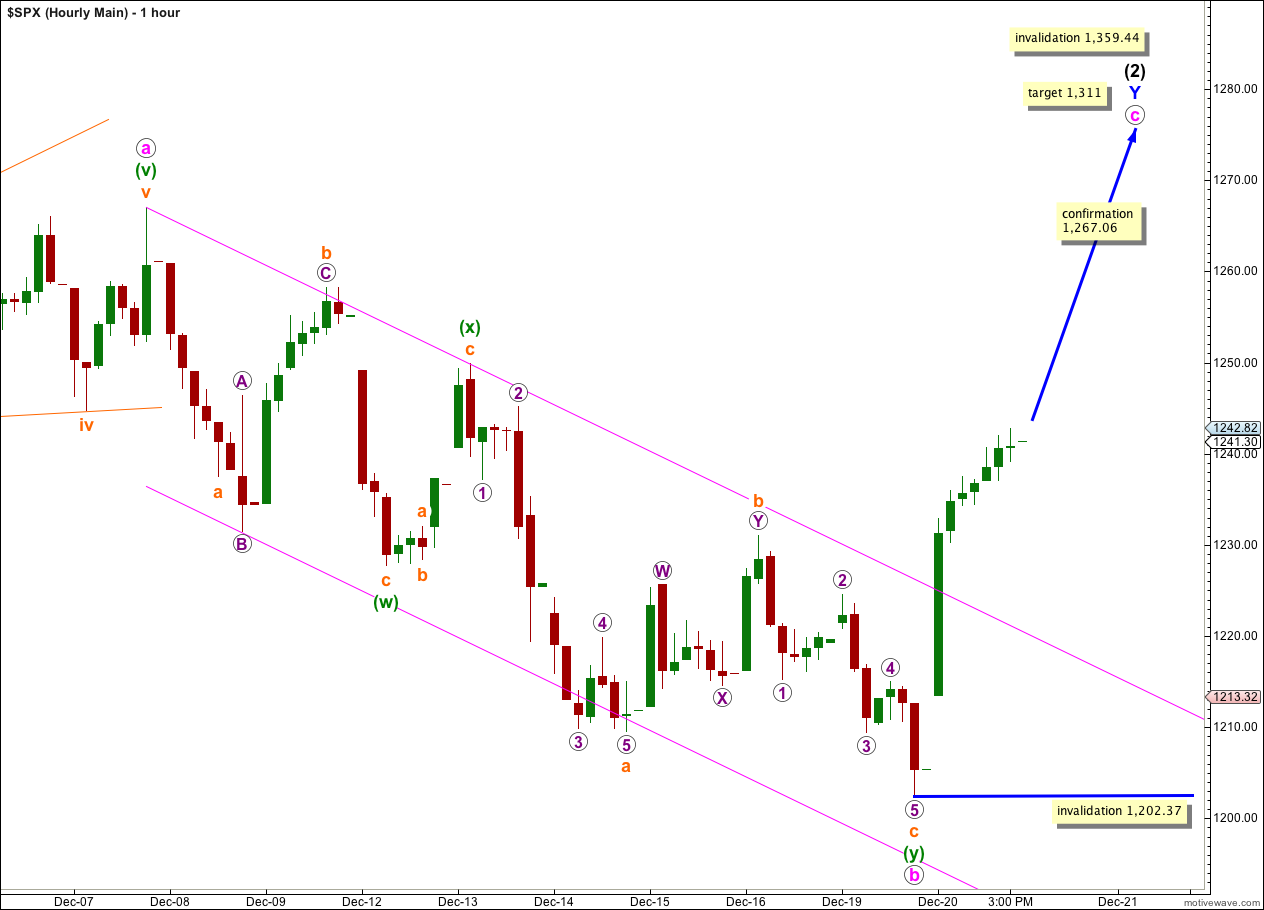
Movement above 1,210.79 and then outside the pink parallel channel provided early indication of a trend change.
When there is more structure within wave c pink to analyse I can refine the target. At this stage it remains at 1,311 where wave c pink would reach equality with wave a pink in length.
Now that we have a trend change confirmed the invalidation point may move up to 1,202.37. Within wave c pink no second wave correction may move beyond the start of the first wave.
Waves a and b pink both lasted a Fibonacci 8 days. If wave c pink also lasts a Fibonacci 8 days it would end on the 30th of December, 2011.
Alternate Wave Count.
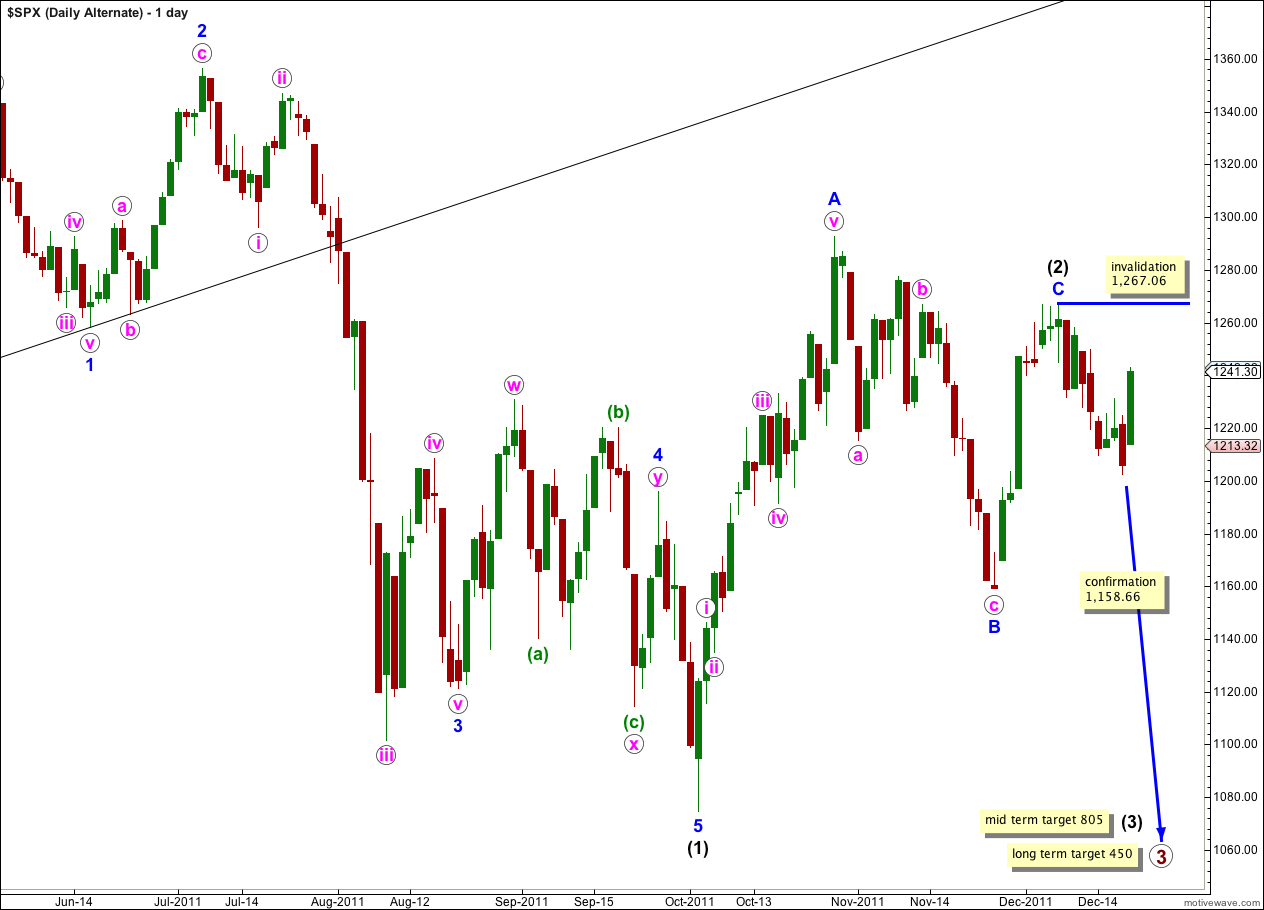
This wave count has a low probability because wave C blue within the zigzag for wave (2) black is severely truncated. However, the subdivisions fit.
Only if we saw very strong downwards movement from this point below 1,158.66 would we need to use this wave count. At that stage it would provide a valid explanation.
Within wave (3) black no second wave correction may move beyond the start of the first wave. This wave count is invalidated with movement above 1,267.06. If this wave count is invalidated by upwards movement then our main wave count could be considered confirmed.
Second Alternate Wave Count.
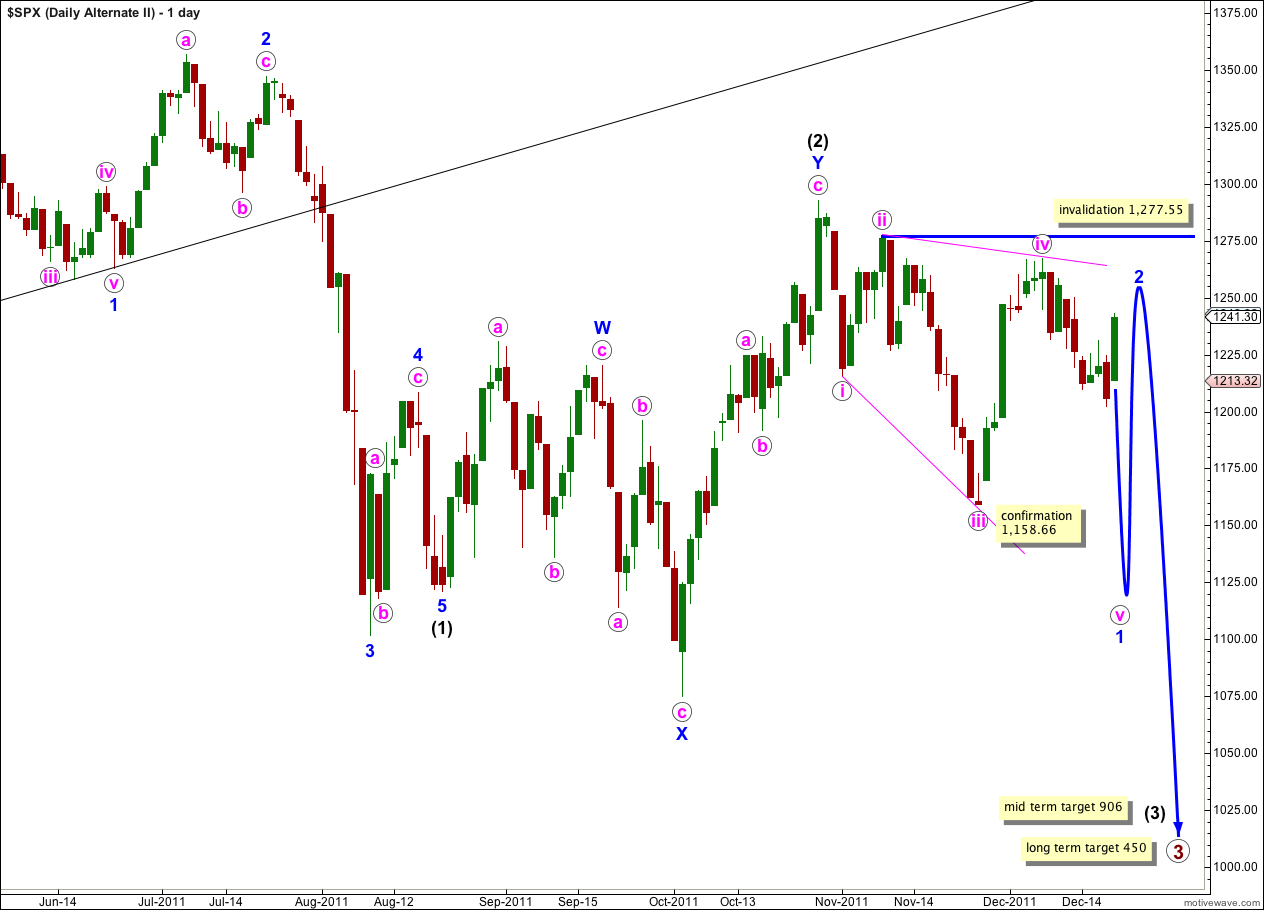
There are four reasons why I consider this wave count to have the lowest probability:
1. Wave iv pink is not an obvious zigzag and it should be.
2. Wave iv pink is already deeper than 0.81 of wave iii pink; this is the maximum common length for wave 4 within a diagonal in relation to wave 3.
3. While leading diagonals are not uncommon, leading expanding diagonals are supposedly less common structures.
4. A similar wave count on the Dow is invalidated; the Dow and S&P 500 have been moving together nicely for some time and it would be highly unusual for them to now diverge.
Within the leading diagonal for wave 1 blue wave iv pink may not move beyond the end of wave ii pink. This wave count is invalidated with movement above 1,277.55.
A leading diagonal may not have a truncated fifth wave. This wave count requires movement below 1,158.66 to remain valid.