
Elliott Wave chart analysis for the S&P 500 for 16th December, 2011. Please click on the charts below to enlarge.
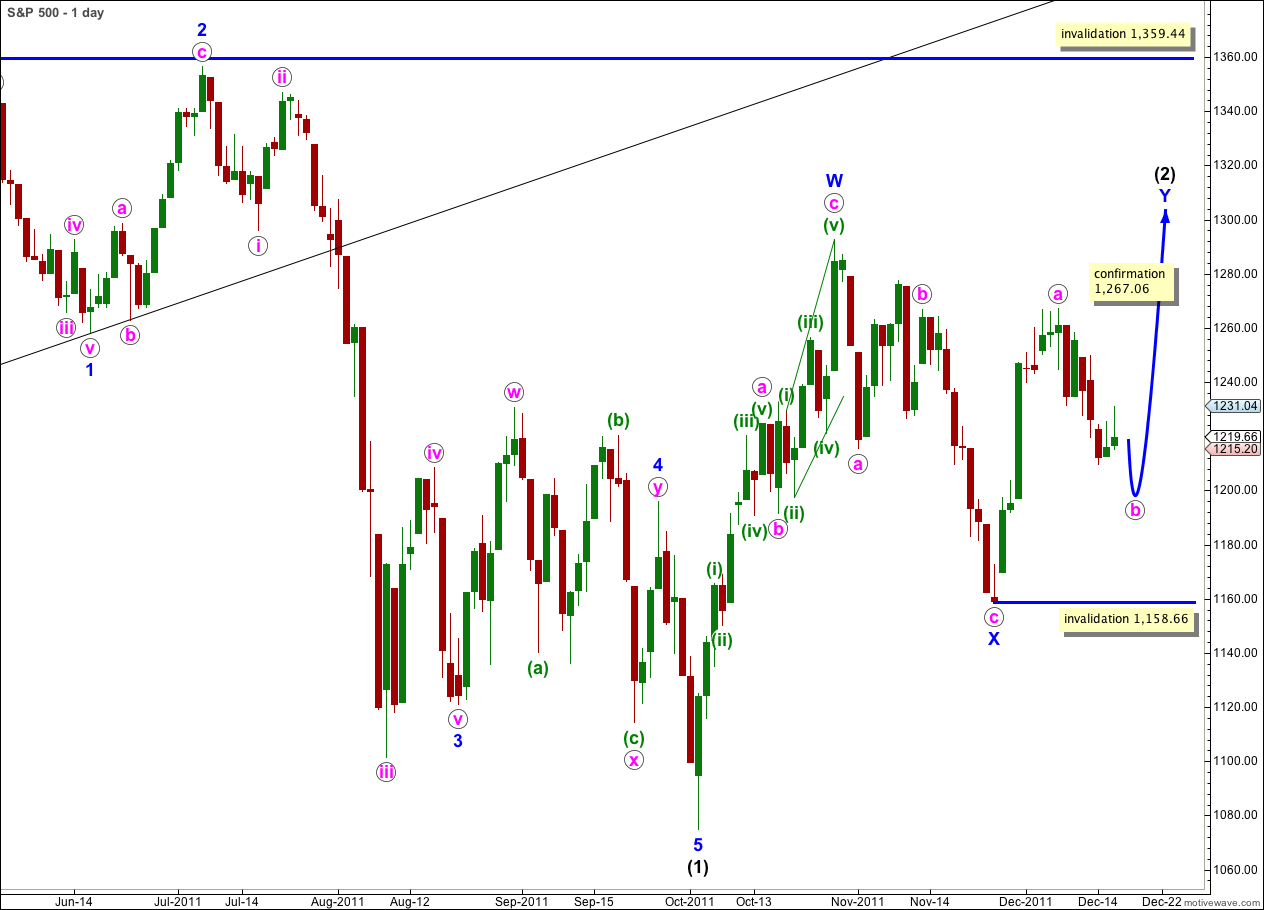
Last analysis expected choppy overlapping overall downwards movement, which is not what we saw for Friday’s session. Friday saw a slight new high before price turned back down again. Price remains firmly within the parallel channel on the hourly chart and we have not had confirmation of a trend change yet.
On the hourly chart I still see an incomplete structure for wave b pink. We should expect yet further downwards movement for another day or two before we see wave c pink move higher to complete wave Y blue.
Wave c pink is highly likely to take price to a new high above the end of wave a pink at 1,267.06 to avoid a truncation. Wave Y blue is highly likely to take price to a new high above the end of wave W blue at 1,292.66 to achieve the purpose of a double zigzag, which is to deepen a correction.
When we know where wave b pink has ended we may calculate a target for wave c pink to complete wave Y blue.
Wave b pink may not move beyond the start of wave a pink. This wave count is invalidated with movement below 1,158.66.
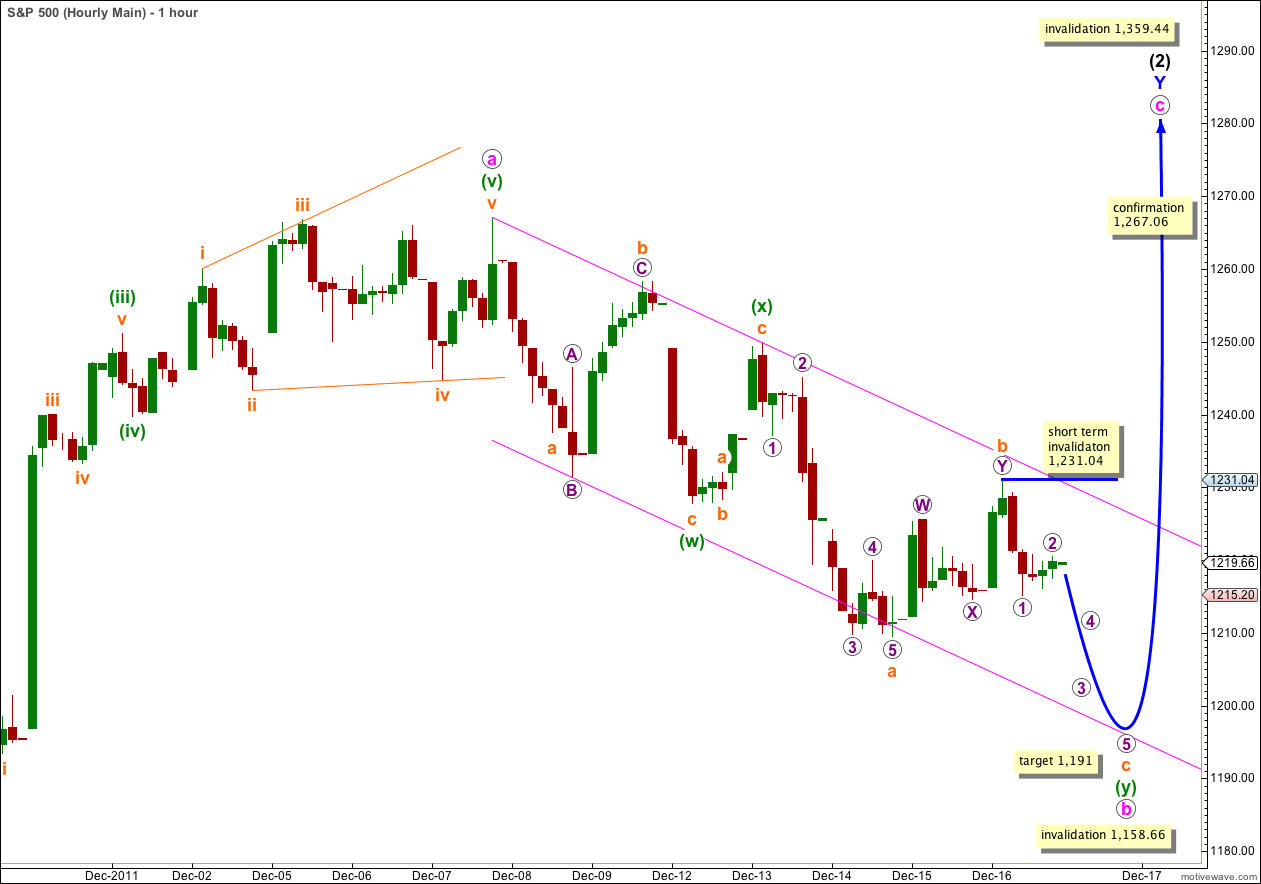
Wave b orange was not complete at the high labeled W purple, although this was a complete zigzag structure. Wave b orange has moved higher as a double zigzag, finding resistance at the upper edge of the parallel channel.
Within wave c orange wave 1 purple looks most like a simple impulse and it is most likely that wave c orange will subdivide into an impulse. The trend downwards for another day or two should be clearly down. At 1,191 wave c orange would reach equality in length with wave a orange. This would take wave b pink to just below the 0.618 Fibonacci ratio of wave a pink.
Within wave c orange wave 2 purple may not move beyond the start of wave 1 purple. This wave count is invalidated with movement above 1,231.04 prior to the end of wave c purple.
We should expect price to remain within the parallel channel drawn here while wave b pink is finishing. Price may end about the lower edge of the channel.
When the channel is breached by upwards movement then we may expect wave b pink is over and wave c pink to new highs should be underway.
Alternate Wave Count.
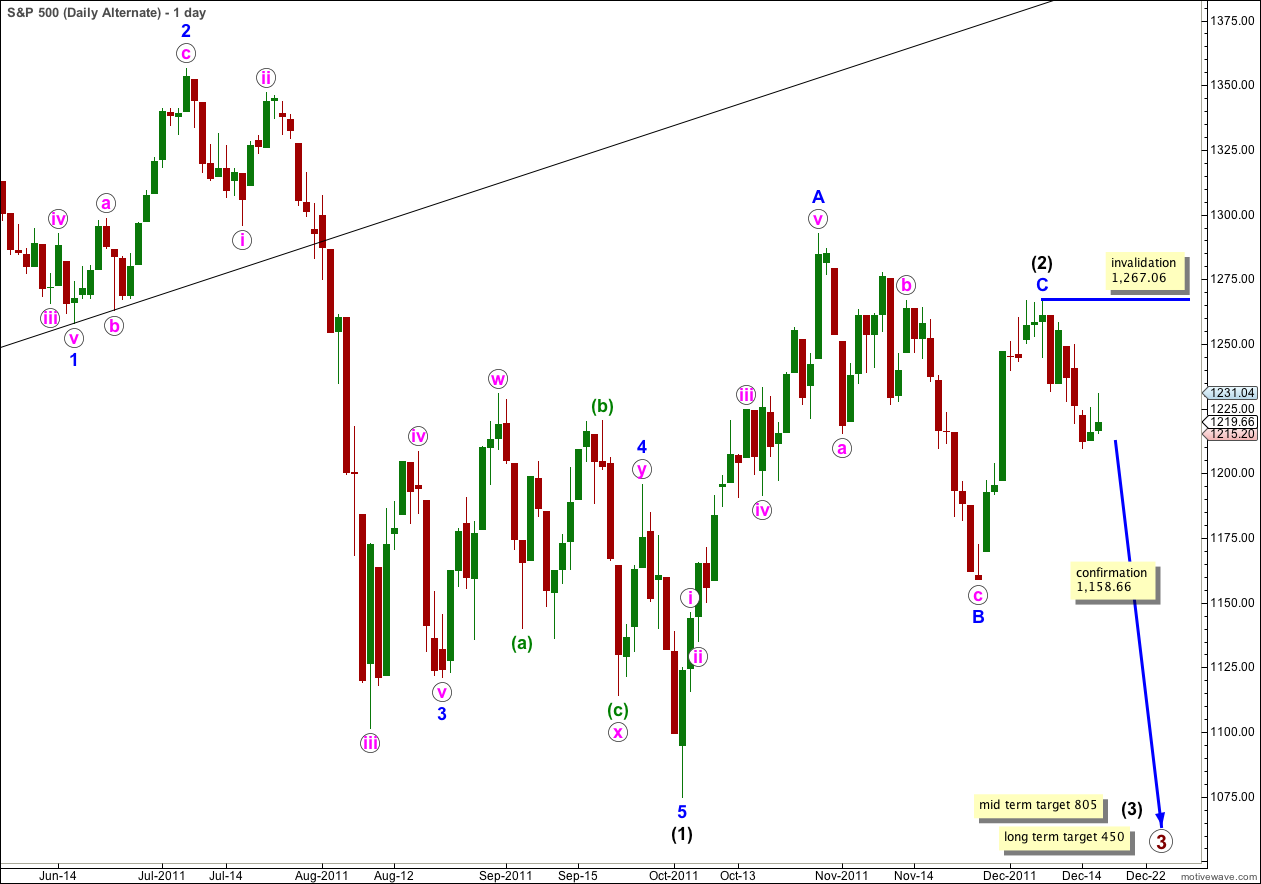
This wave count has a low probability because wave C blue within the zigzag for wave (2) black is severely truncated. However, the subdivisions fit.
Only if we saw very strong downwards movement from this point below 1,158.66 would we need to use this wave count. At that stage it would provide a valid explanation.
Within wave (3) black no second wave correction may move beyond the start of the first wave. This wave count is invalidated with movement above 1,267.06. If this wave count is invalidated by upwards movement then our main wave count could be considered confirmed.
Second Alternate Wave Count.
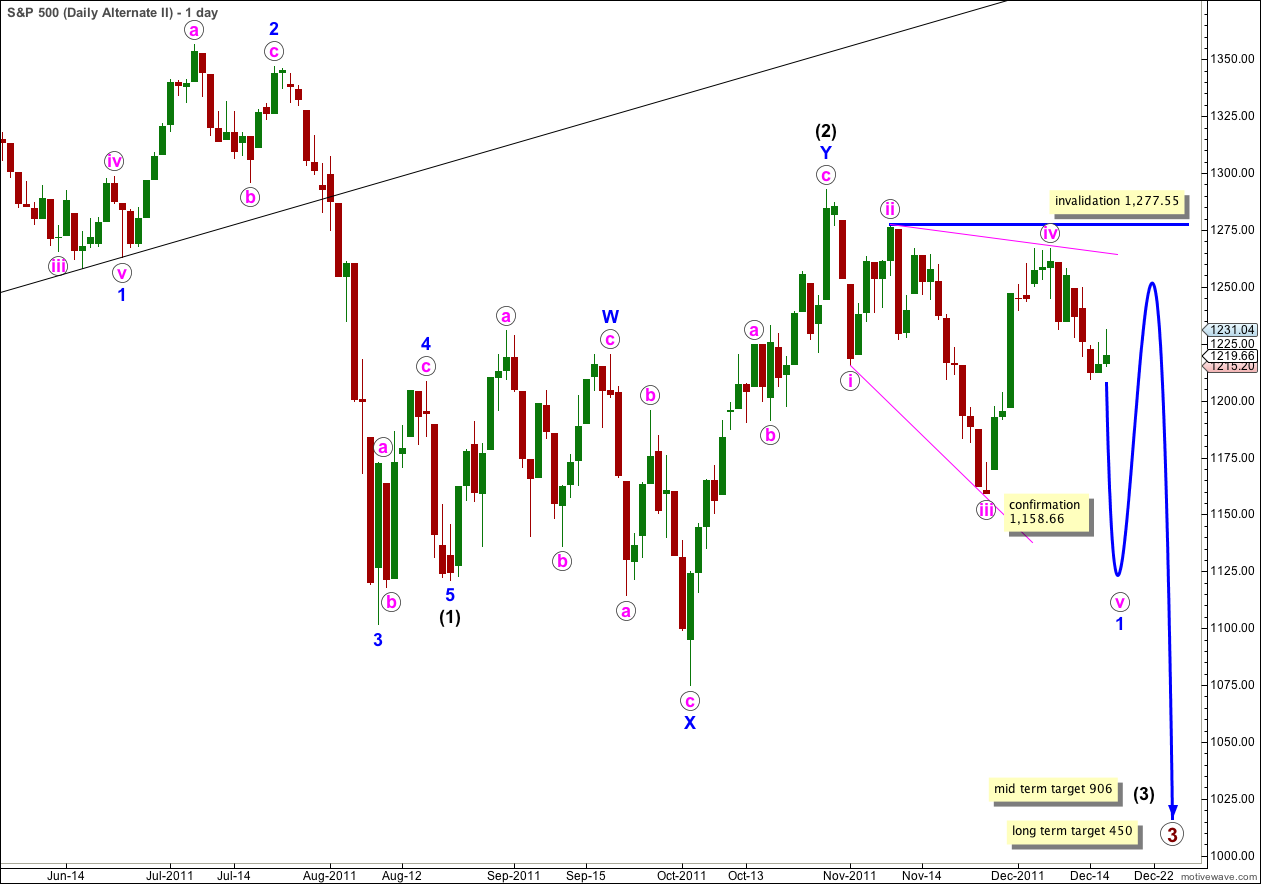
There are four reasons why I consider this wave count to have the lowest probability:
1. Wave iv pink is not an obvious zigzag and it should be.
2. Wave iv pink is already deeper than 0.81 of wave iii pink; this is the maximum common length for wave 4 within a diagonal in relation to wave 3.
3. While leading diagonals are not uncommon, leading expanding diagonals are supposedly less common structures.
4. A similar wave count on the Dow is invalidated; the Dow and S&P 500 have been moving together nicely for some time and it would be highly unusual for them to now diverge.
Within the leading diagonal for wave 1 blue wave iv pink may not move beyond the end of wave ii pink. This wave count is invalidated with movement above 1,277.55.
A leading diagonal may not have a truncated fifth wave. This wave count requires movement below 1,158.66 to remain valid.