
Elliott Wave chart analysis for the S&P 500 for 15th December, 2011. Please click on the charts below to enlarge.
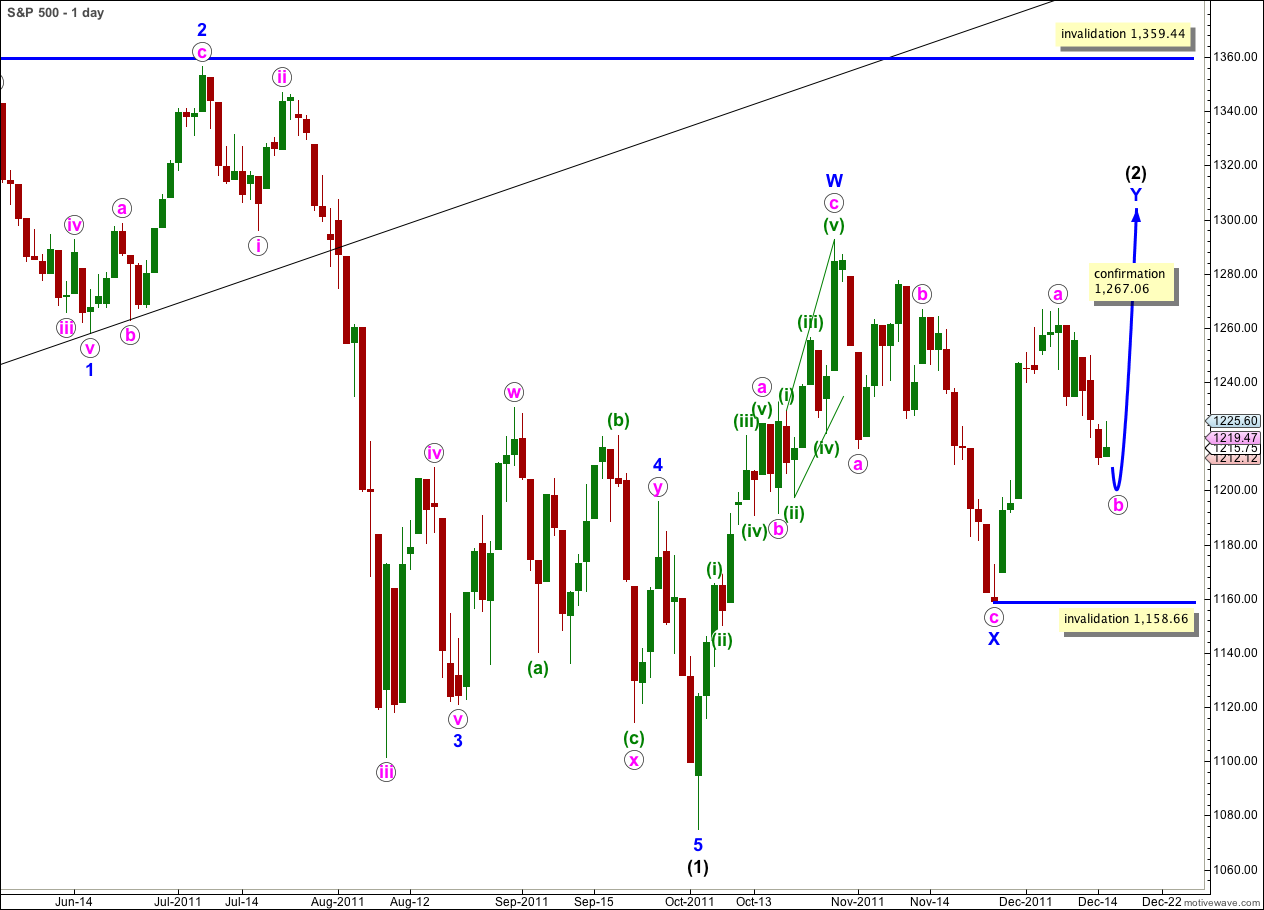
As expected from last analysis the S&P 500 has moved higher, in slow unconvincing choppy movement. Before moving higher, however, a very slight new low was made, just 0.36 points below the previous day’s low. This affects the wave count.
On the hourly and 5 minute chart it looks most likely that we shall see a little more downwards movement before upwards movement completes the zigzag for wave Y blue.
Wave b pink may not move beyond the start of wave a pink. This wave count is invalidated with movement below 1,158.66.
When wave b pink is complete we can again calculate targets for wave Y blue to complete wave (2) black.
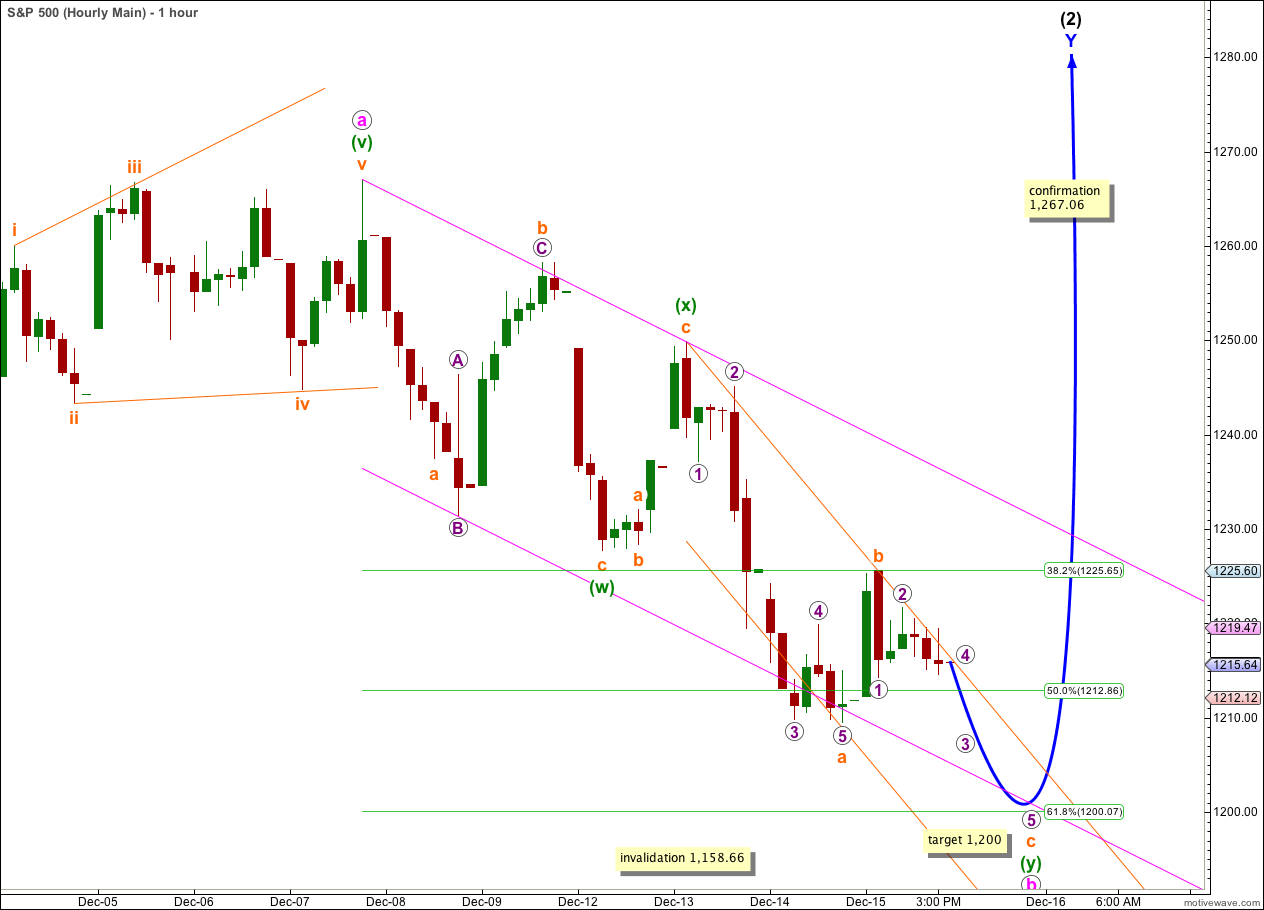
Downwards movement completed a five wave impulse and this must be wave a orange within wave (y) green. Wave b orange on the 5 minute chart is a perfect three wave zigzag.
Ratios within wave a orange are: wave 3 purple is 2.08 points longer than 2.618 the length of wave 1 purple, and wave 5 purple has no Fibonacci ratio to either waves 1 or 3 purple.
Within wave c orange only wave 1 purple is complete and on the 5 minute chart it looks most like a zigzag. This indicates that wave c orange is most likely to unfold as an ending diagonal, with slow choppy overlapping movement generally trending downwards.
At 1,200 wave c orange would reach 0.618 the length of wave a orange. This would bring wave b pink to end about the 0.618 Fibonacci ratio of wave a pink.
If wave b pink ends in two more trading days it would have lasted a Fibonacci 8 days. It may end after Monday’s session.
Alternate Wave Count.
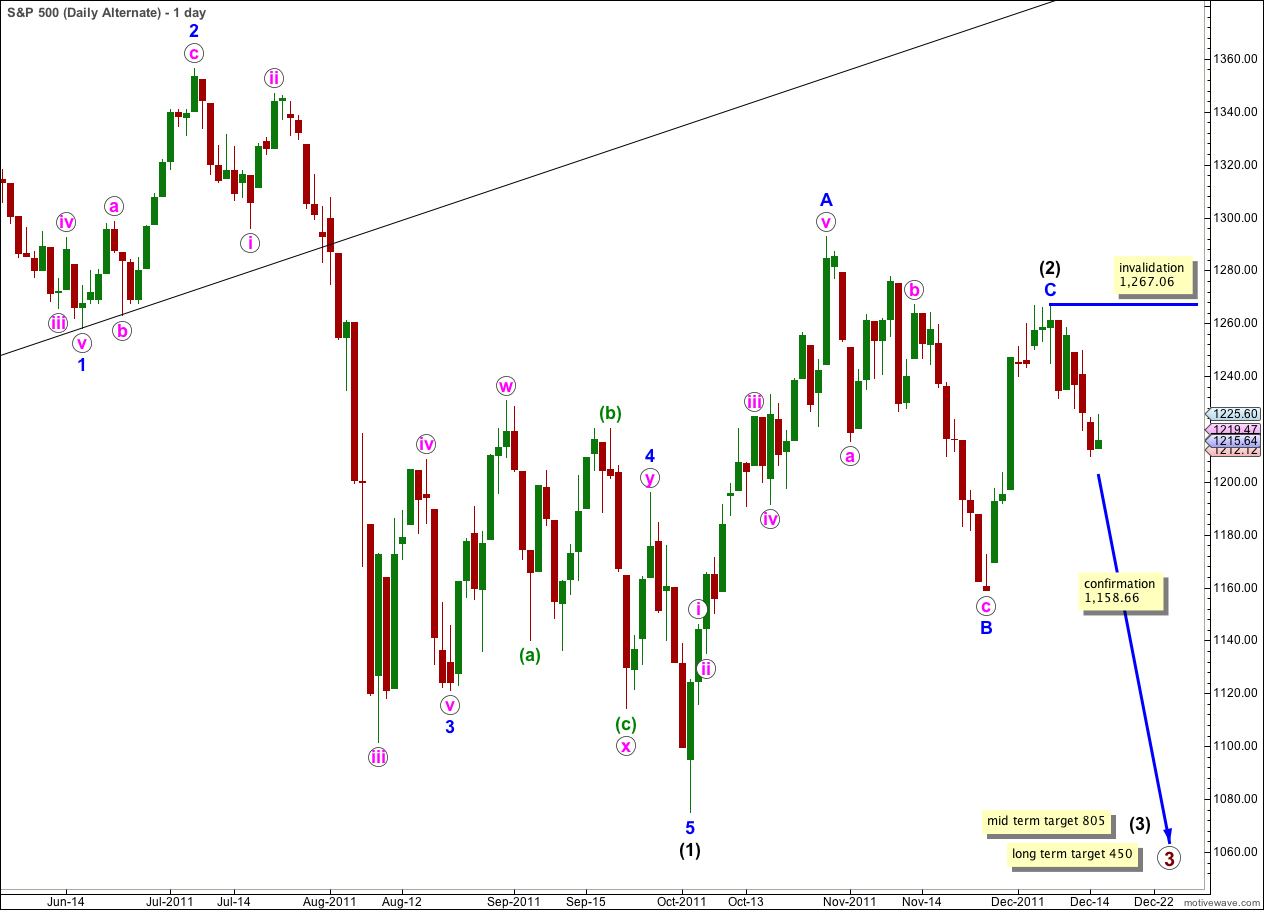
This wave count has a low probability because wave C blue within the zigzag for wave (2) black is severely truncated. However, the subdivisions fit.
Only if we saw very strong downwards movement from this point below 1,158.66 would we need to use this wave count. At that stage it would provide a valid explanation.
Within wave (3) black no second wave correction may move beyond the start of the first wave. This wave count is invalidated with movement above 1,267.06. If this wave count is invalidated by upwards movement then our main wave count could be considered confirmed.
Second Alternate Wave Count.
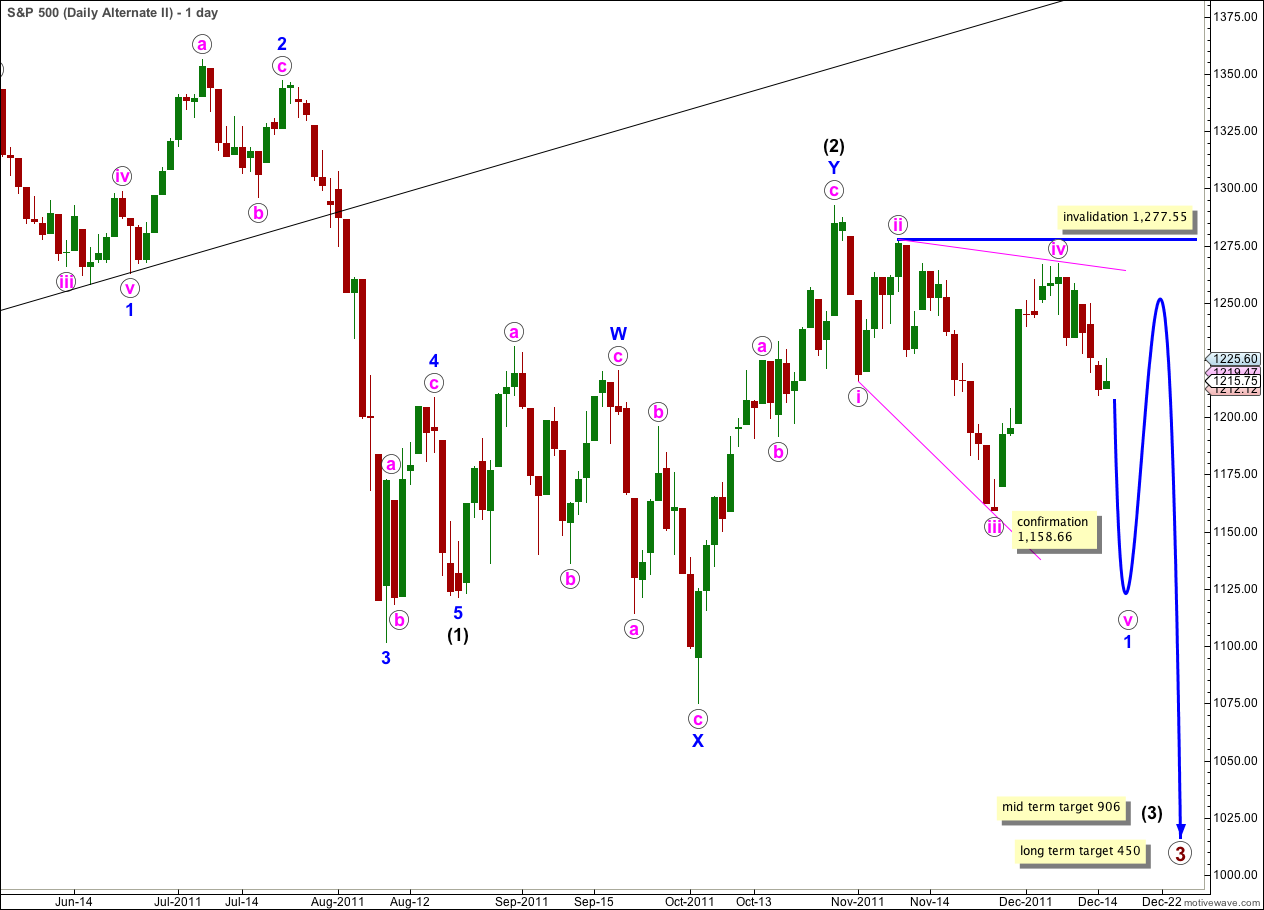
There are four reasons why I consider this wave count to have the lowest probability:
1. wave iv pink is not an obvious zigzag and it should be.
2. wave iv pink is already deeper than 0.81 of wave iii pink; this is the maximum common length for wave 4 within a diagonal in relation to wave 3.
3. while leading diagonals are not uncommon, leading expanding diagonals are supposedly less common structures.
4. a similar wave count on the Dow is invalidated; the Dow and S&P 500 have been moving together nicely for some time and it would be highly unusual for them to now diverge.
Within the leading diagonal for wave 1 blue wave iv pink may not move beyond the end of wave ii pink. This wave count is invalidated with movement above 1,277.55.
A leading diagonal may not have a truncated fifth wave. This wave count requires movement below 1,158.66 to remain valid.