
Elliott Wave chart analysis for the S&P 500 for 12th December, 2011. Please click on the charts below to enlarge.
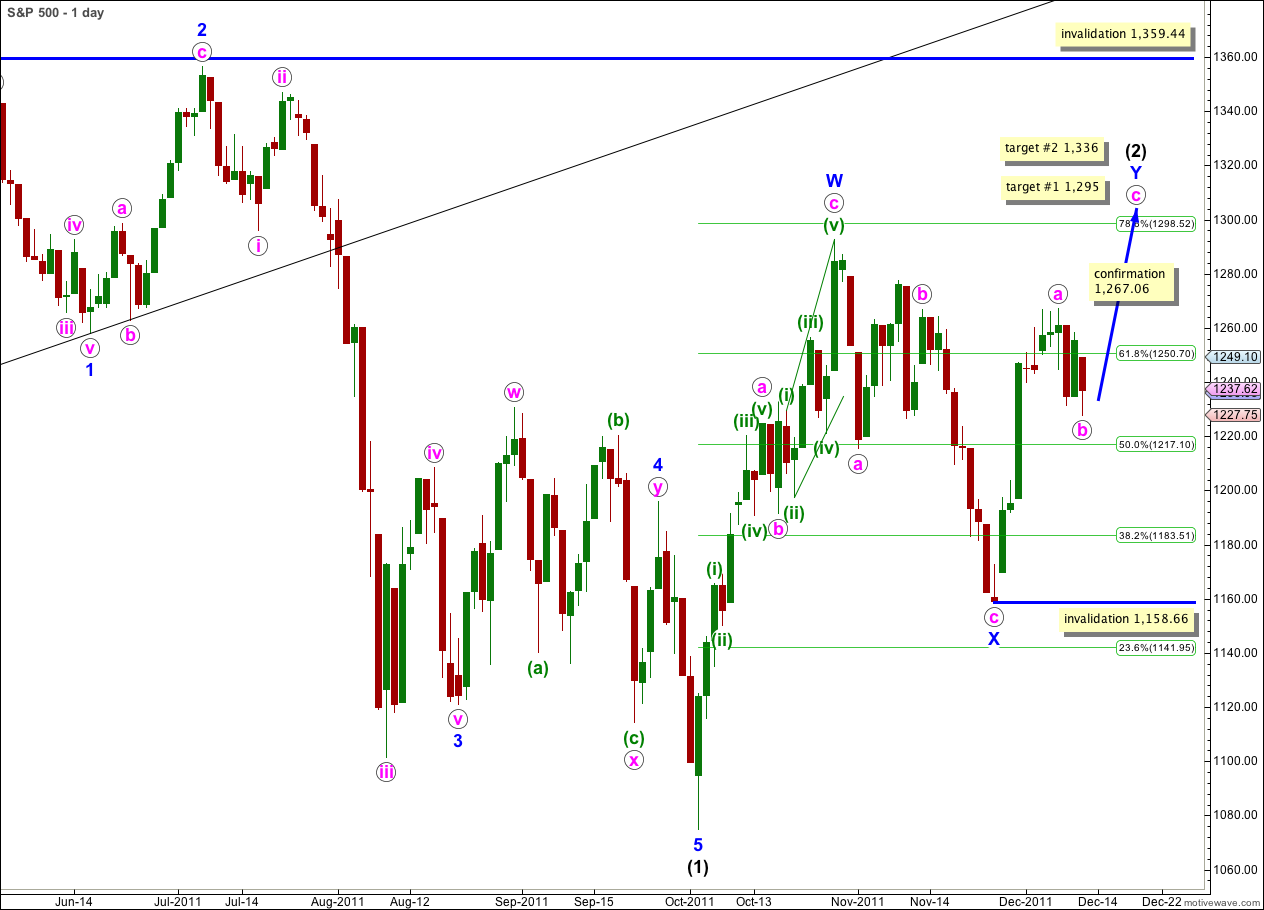
Last analysis expected overall downwards movement from the S&P 500 to start the new trading week. We did not get a little upwards movement first, as had seemed most likely, but we have seen a new low.
Wave b pink within the zigzag for wave Y blue is now a very clear three wave structure on the daily and hourly charts.
From this point we should expect that it is highly likely we shall see a new high above the end of a pink at 1,267.06, and also most likely a new high above the end of W blue at 1,292.66.
At 1,295 wave c pink would reach 0.618 the length of wave a pink. If price continues to rise through this first target and the structure of wave c pink requires further upwards movement to complete it, then the second target is at 1,336 where wave c pink would reach equality with wave a pink. These targets assume that the low for wave b pink remains at 1,227.75. If the low moves a little lower then the targets will need adjusting.
Wave b pink may not move beyond the start of wave a pink. This wave count is invalidated with movement below 1,158.66.
Wave (2) black may not move beyond the start of wave (1) black. This wave count is invalidated with movement above 1,359.44.
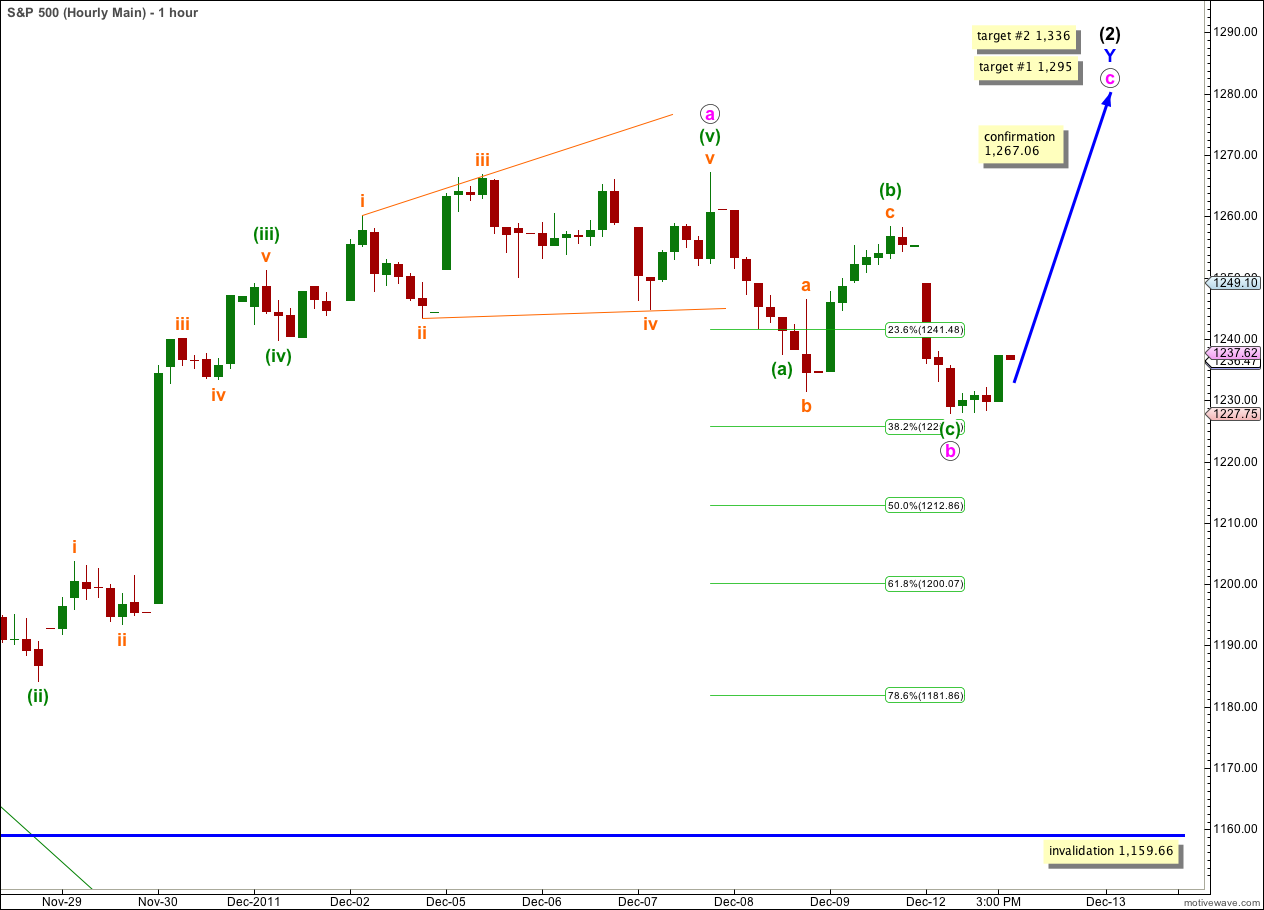
We have only one hourly wave count for our main wave count today.
Wave b pink subdivides into a zigzag. Wave (b) within it is an expanded flat correction. Within wave b pink wave (c) green is just 0.91 points longer than equality with wave (a) green. Wave b pink ended just a little short of the 0.382 Fibonacci ratio of wave a pink, and not just below this point as we had expected.
On the 5 minute chart wave (c) green subdivides perfectly into a five wave impulse. It is most likely that it is over here.
Wave c pink must subdivide into a five wave structure, either an impulse (most likely) or an ending diagonal (less likely).
Any further downwards movement for wave b pink may not move beyond the start of wave a pink. This wave count is invalidated with movement below 1,159.66.
Alternate Wave Count.
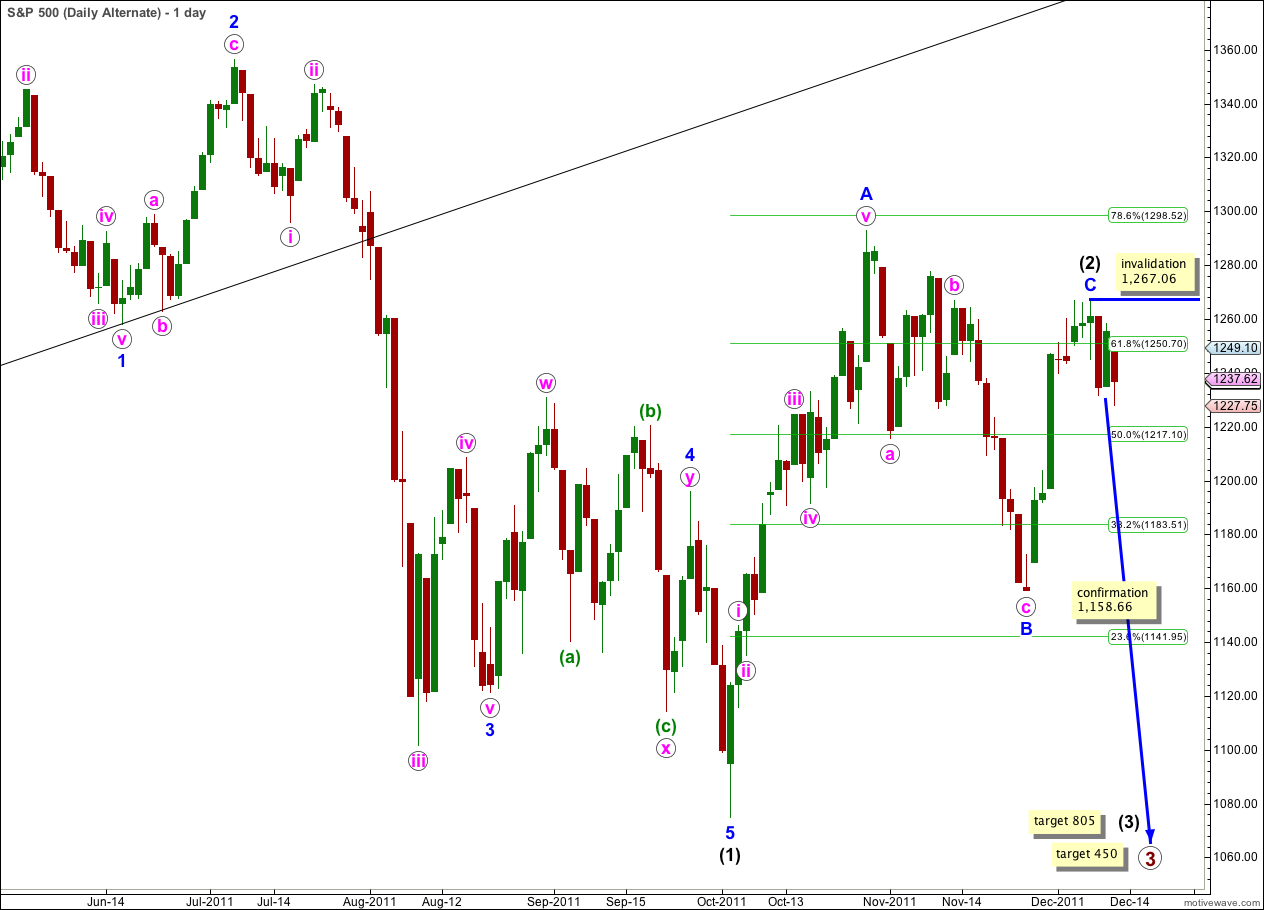
This wave count has a low probability because wave C blue within the zigzag for wave (2) black is severely truncated. However, the subdivisions fit.
Only if we saw very strong downwards movement from this point below 1,158.66 would we need to use this wave count. At that stage it would provide a valid explanation.
Within wave (3) black no second wave correction may move beyond the start of the first wave. This wave count is invalidated with movement above 1,267.06.
Second Alternate Wave Count.
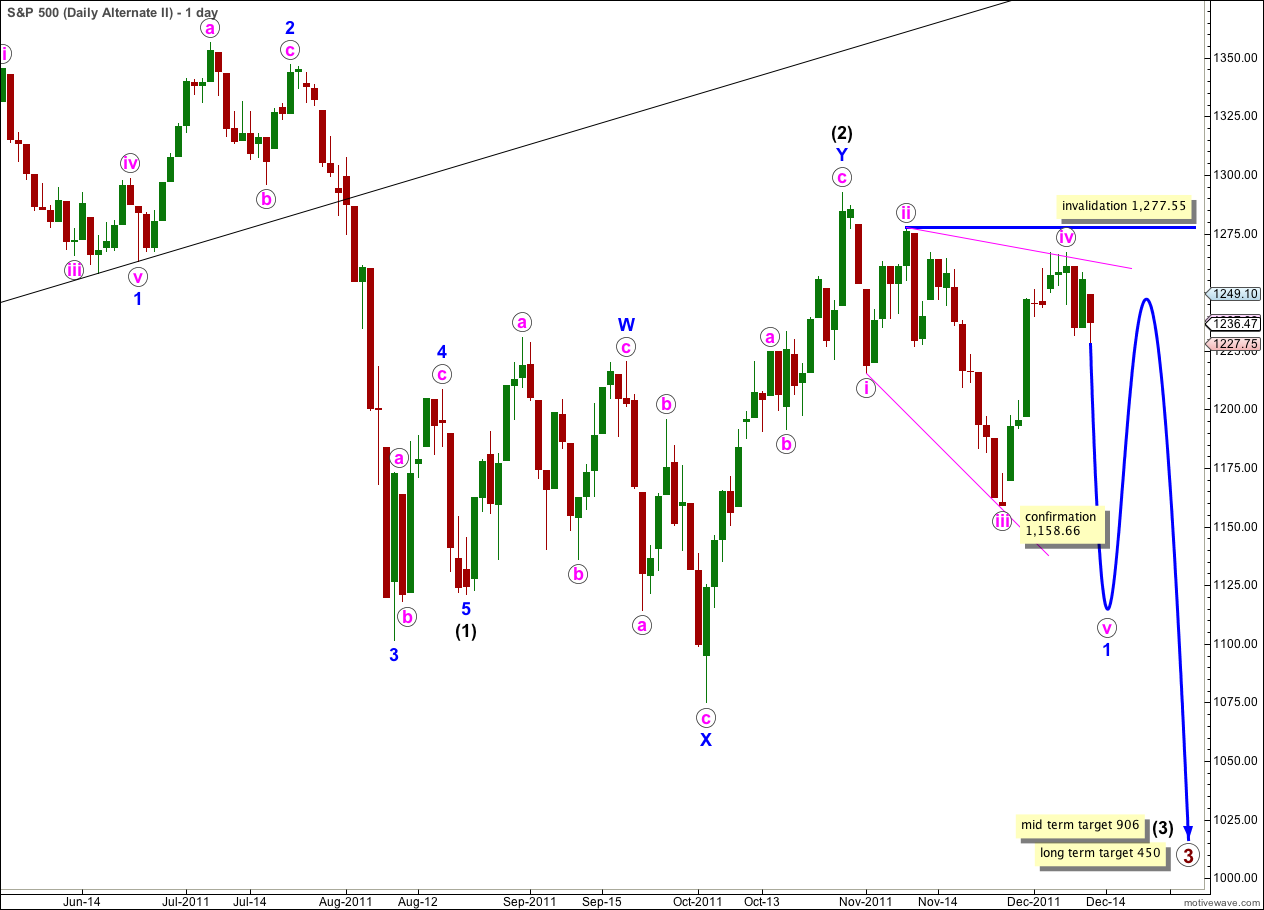
There are four reasons why I consider this wave count to have the lowest probability:
1. wave iv pink is not an obvious zigzag and it should be.
2. wave iv pink is already deeper than 0.81 of wave iii pink; this is the maximum common length for wave 4 within a diagonal in relation to wave 3.
3. while leading diagonals are not uncommon, leading expanding diagonals are supposedly less common structures.
4. a similar wave count on the Dow is invalidated; the Dow and S&P 500 have been moving together nicely for some time and it would be highly unusual for them to now diverge.
Within the leading diagonal for wave 1 blue wave iv pink may not move beyond the end of wave ii pink. This wave count is invalidated with movement above 1,277.55.
A leading diagonal may not have a truncated fifth wave. This wave count requires movement below 1,158.66 to remain valid.