
Elliott Wave chart analysis for the S&P 500 for 8th December, 2011. Please click on the charts below to enlarge.
Movement below 1,244.08 has confirmed a trend change, at least for the short term. This wave count was yesterday’s alternate and is today our main wave count because it has the best look, fit, and the subdivisions are all correct.
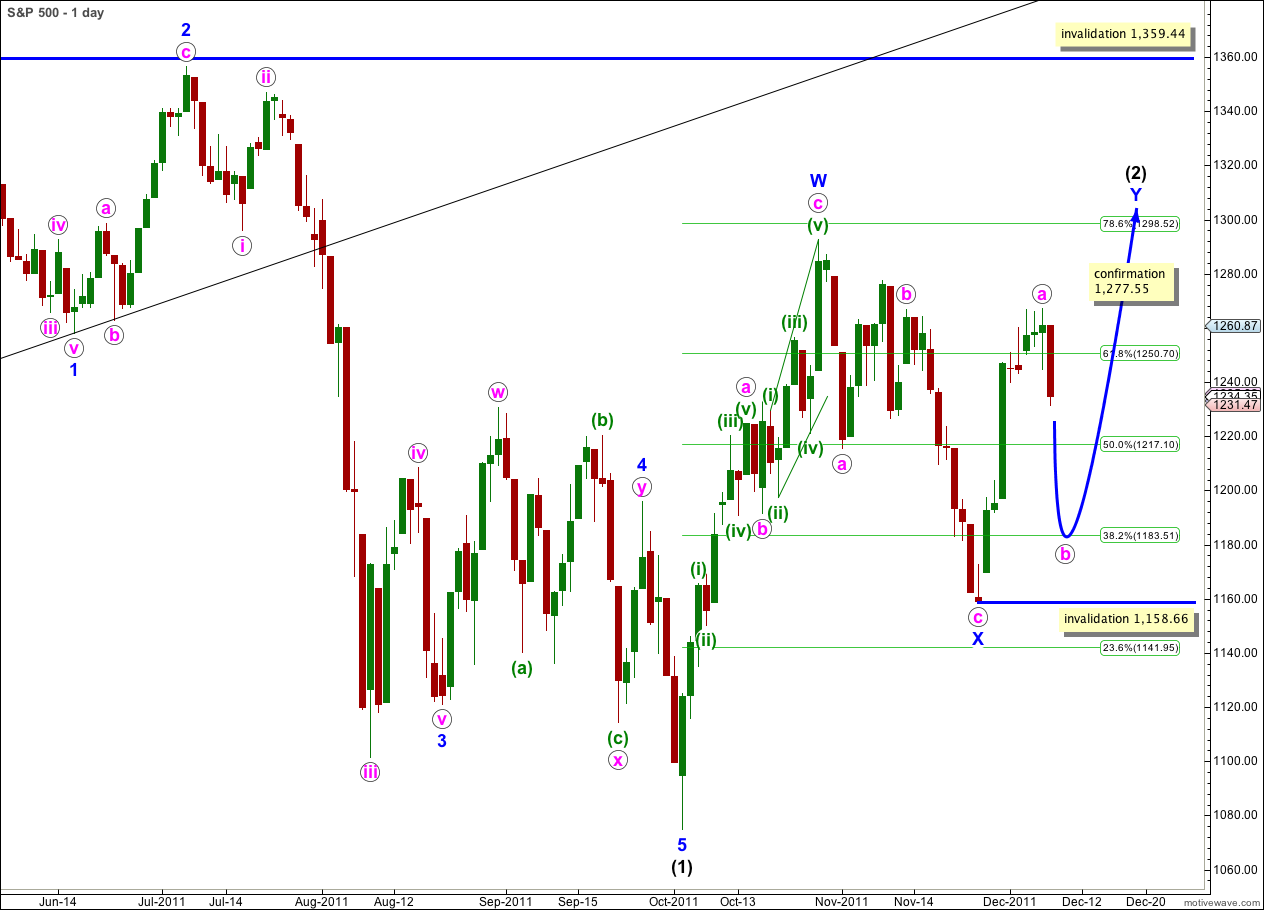
Here wave (2) black is unfolding as a double zigzag structure, and is within the second zigzag of the double.
Within the zigzag for wave Y blue it is highly likely that wave c pink to end it would take price above the high of wave a pink at 1,267.06 to avoid a truncation.
The purpose of a double zigzag is to deepen a correction and the probability that wave Y blue would take price to a new high above the end of wave W blue at 1,292.66 is high.
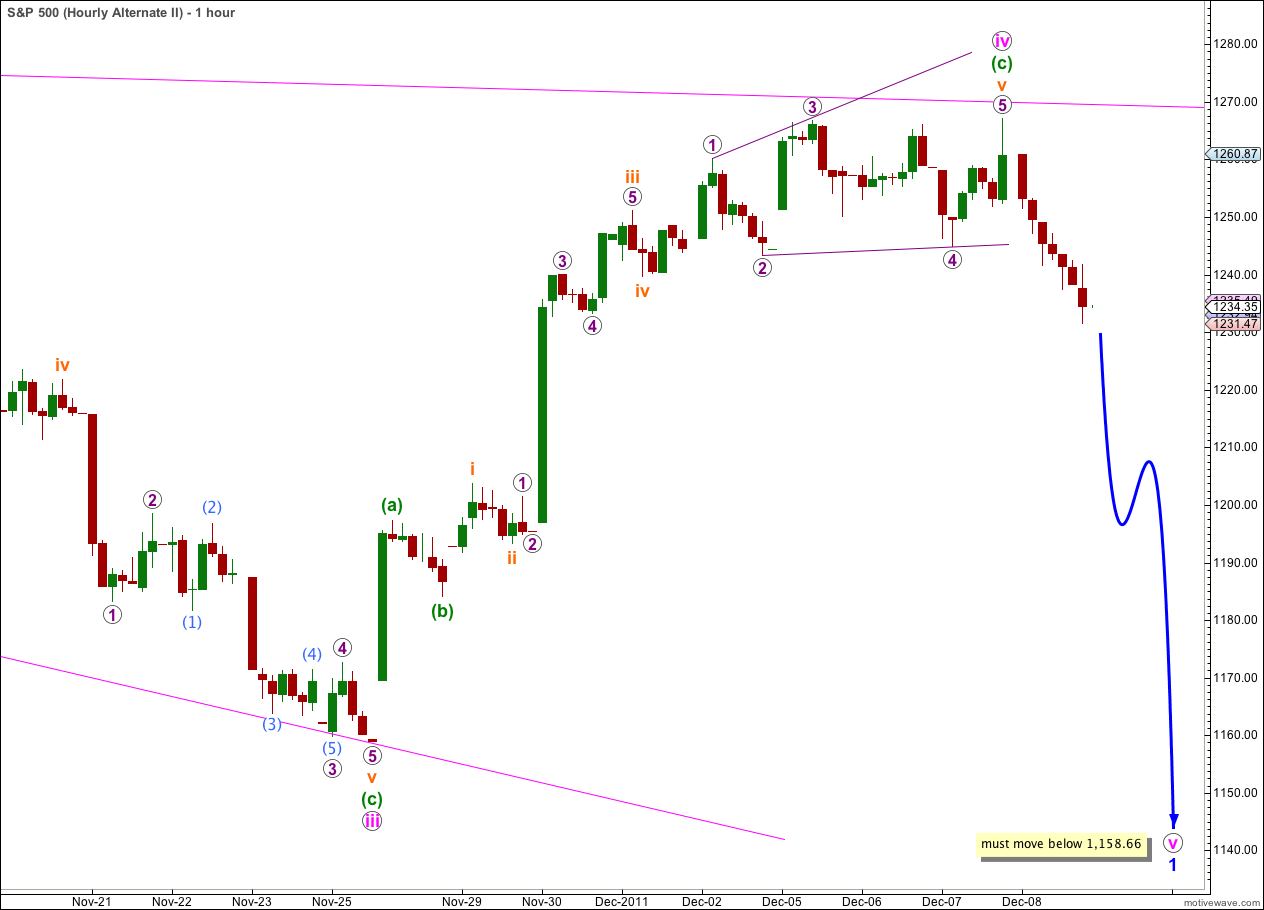
This wave count should see 3 to 4 days of downwards movement for wave b pink, most likely to unfold as a zigzag. Wave b pink may not move beyond the start of wave a pink. This wave count is invalidated with movement below 1,158.66.
Thereafter, wave c pink upwards would complete the second zigzag for wave Y blue. Wave c pink would take about 8 days to complete.
When wave (2) black is complete then the S&P 500 would be ready for a dramatic fall as wave (3) black within primary wave 3 begins.
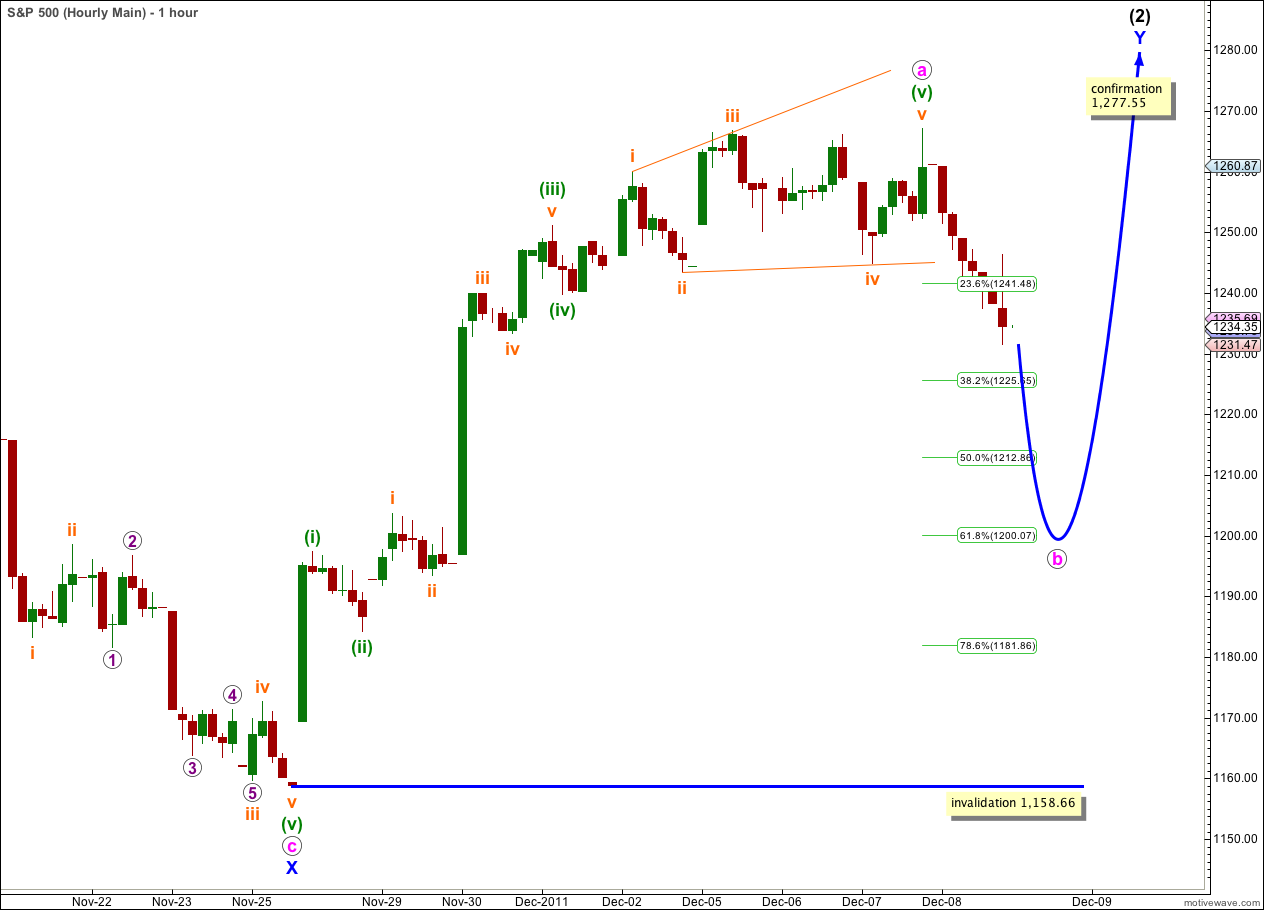
Wave a pink subdivides neatly into a five wave impulse. Wave (v) green subdivides into an ending diagonal where the third wave is slightly the longest, and wave v orange is longer than wave i orange.
Ratios within wave a pink are: wave (iii) green is 4.24 points longer than 1.618 the length of wave (i) green, and wave (v) green is 1.76 points longer than 0.382 the length of wave (iii) green.
Wave b pink must subdivide into a three or a triangle. It is most likely to end about 0.618 the length of wave a pink at 1,200.
Wave b pink may not move beyond the start of wave a pink. This wave count is invalidated with movement below 1,158.66.
Alternate Wave Count.
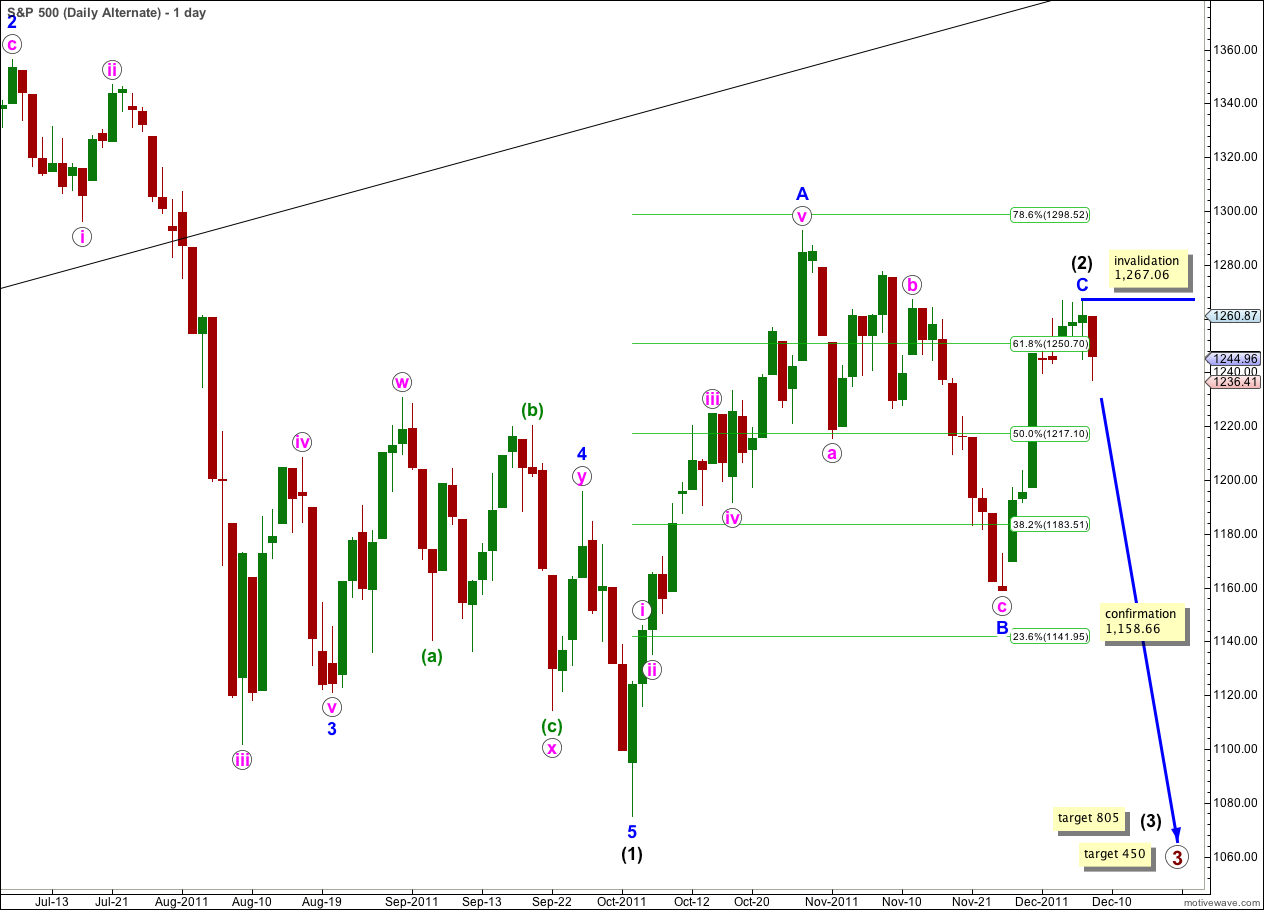
It is possible that wave (2) black has just ended. If price falls strongly from here below 1,158.66 then this wave count will be my preferred wave count.
This wave count has a good fit, all the subdivisions are easily correct, but it involves a severe truncation for wave C blue of the zigzag that is wave (2) black. This reduces the probability of this wave count, but does not invalidate it.
Any movement above 1,267.06 would immediately invalidate this wave count as within wave (3) black no second wave correction may move beyond the start of the first wave.
Second Alternate Wave Count.
This wave count is possible, but I consider it to have the lowest probability of the three wave counts we have today.
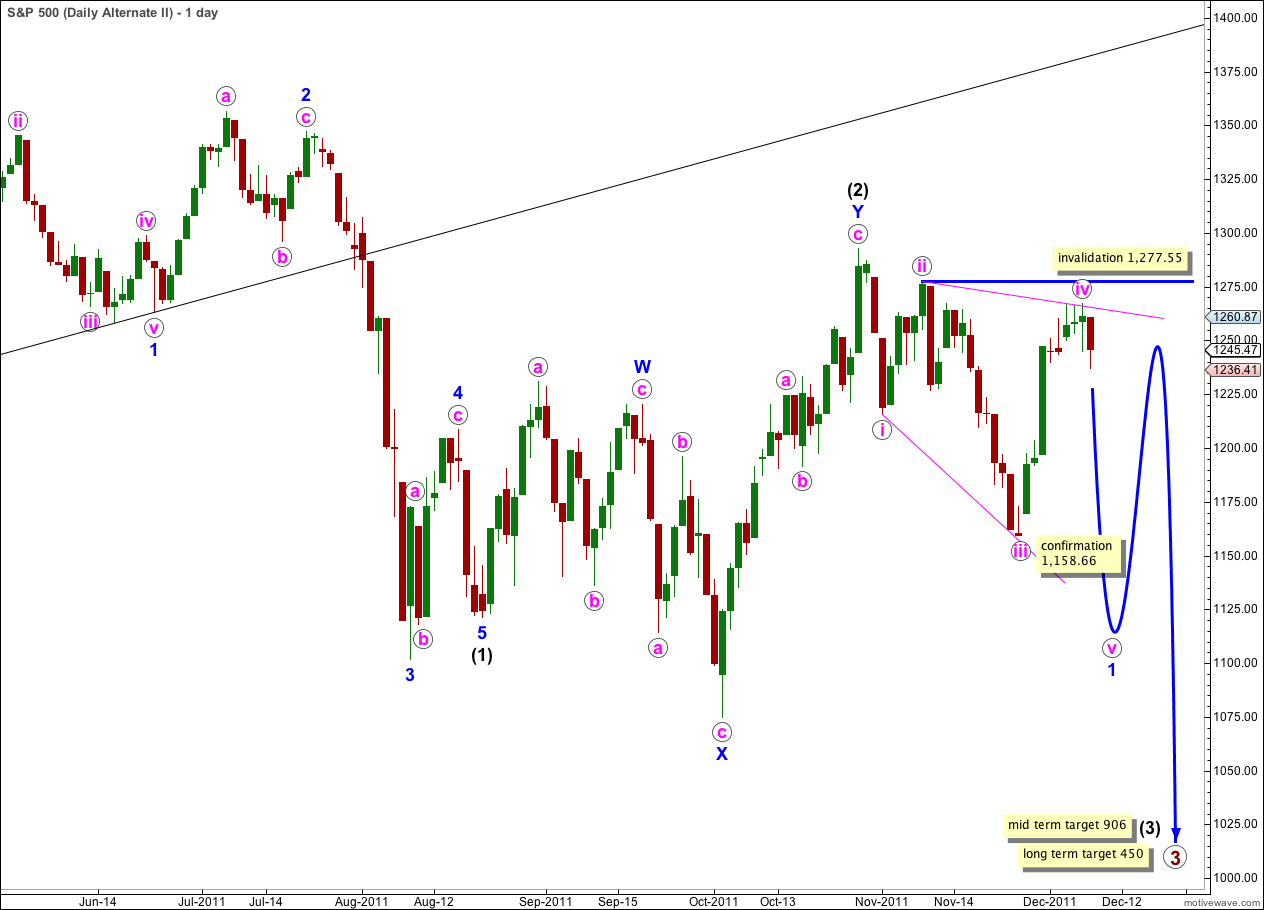
Wave (2) black is over as a double zigzag, and wave 1 blue within wave (3) black is unfolding as a leading expanding diagonal.
A leading diagonal must have subwaves 2 and 4 as zigzags. Here wave ii pink is a clear zigzag, but it is difficult to see wave iv pink as a zigzag. I have played around with the subdivisions on the hourly chart with reference to a 5 minute chart, and it is just possible to see wave iv pink complete here as a zigzag. However, on the hourly chart this structure really does look like an impulse, and the subdivisions do fit better as an impulse on the 5 minute chart. This movement is ambiguous.
If this wave count is correct then what I would expect would be most likely from here is a small zigzag downwards followed by a five up to a slight new high above 1,267.06 but not above 1,277.55. That would complete an obvious zigzag for wave iv pink.
To summarise this wave count there are three reasons why I consider it to have the lowest probability:
1. wave iv pink is not an obvious zigzag and it should be.
2. wave iv pink is already deeper than 0.81 of wave iii pink; this is the maximum common length for wave 4 within a diagonal in relation to wave 3.
3. while leading diagonals are not uncommon, leading expanding diagonals are supposedly less common structures.
Here is a possible subdivision on the hourly chart showing how wave iv pink could be seen as a zigzag.
The difference between this hourly wave count and the main wave count hourly chart is within the first part of wave iii orange. Here we would need to count an extra first and second wave. This does not have as good a fit on the 5 minute chart.
If this wave count is correct we may see downwards movement from here, most likely in a zigzag structure, which must move to a new low below the end of iii pink at 1,158.66.