
Elliott Wave chart analysis for the S&P 500 for 7th December, 2011. Please click on the charts below to enlarge.
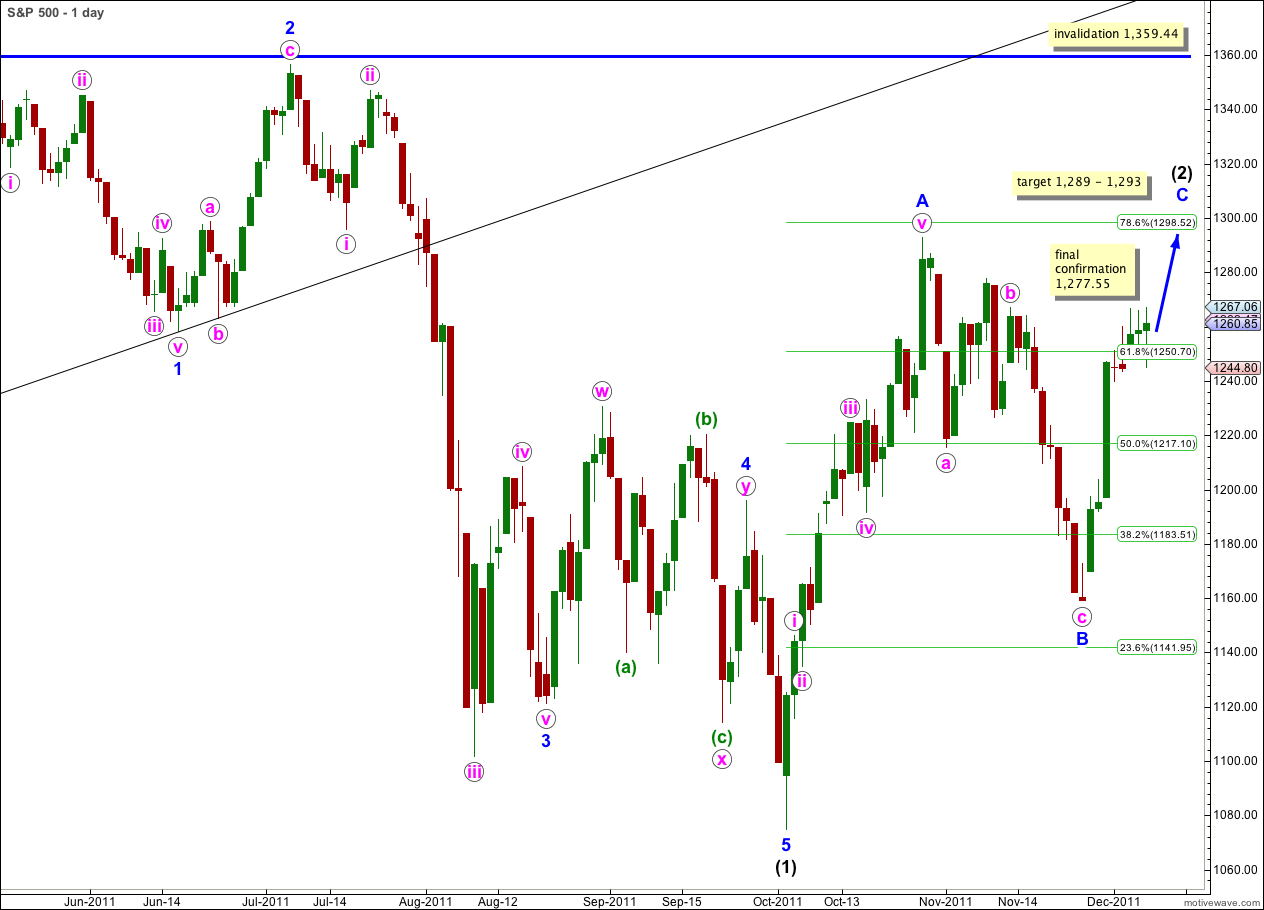
Slight movement above 1,266.98 has added a little more confidence to this wave count. Movement above 1,277.55 would confirm it.
The structure for the final wave within wave C blue of (2) black is still incomplete. We should see a little more upwards movement before it is over.
It is possible that wave C blue could be truncated (fail to move beyond the end of A blue at 1,292.66) but it is more likely that it would not be. Therefore, the probability that price will move at least a little above 1,292.66 is reasonable. At 1,293 wave C blue would reach 0.618 the length of wave A blue.
Wave (2) black may not move beyond the start of wave (1) black. This wave count is invalidated with movement above 1,359.44.
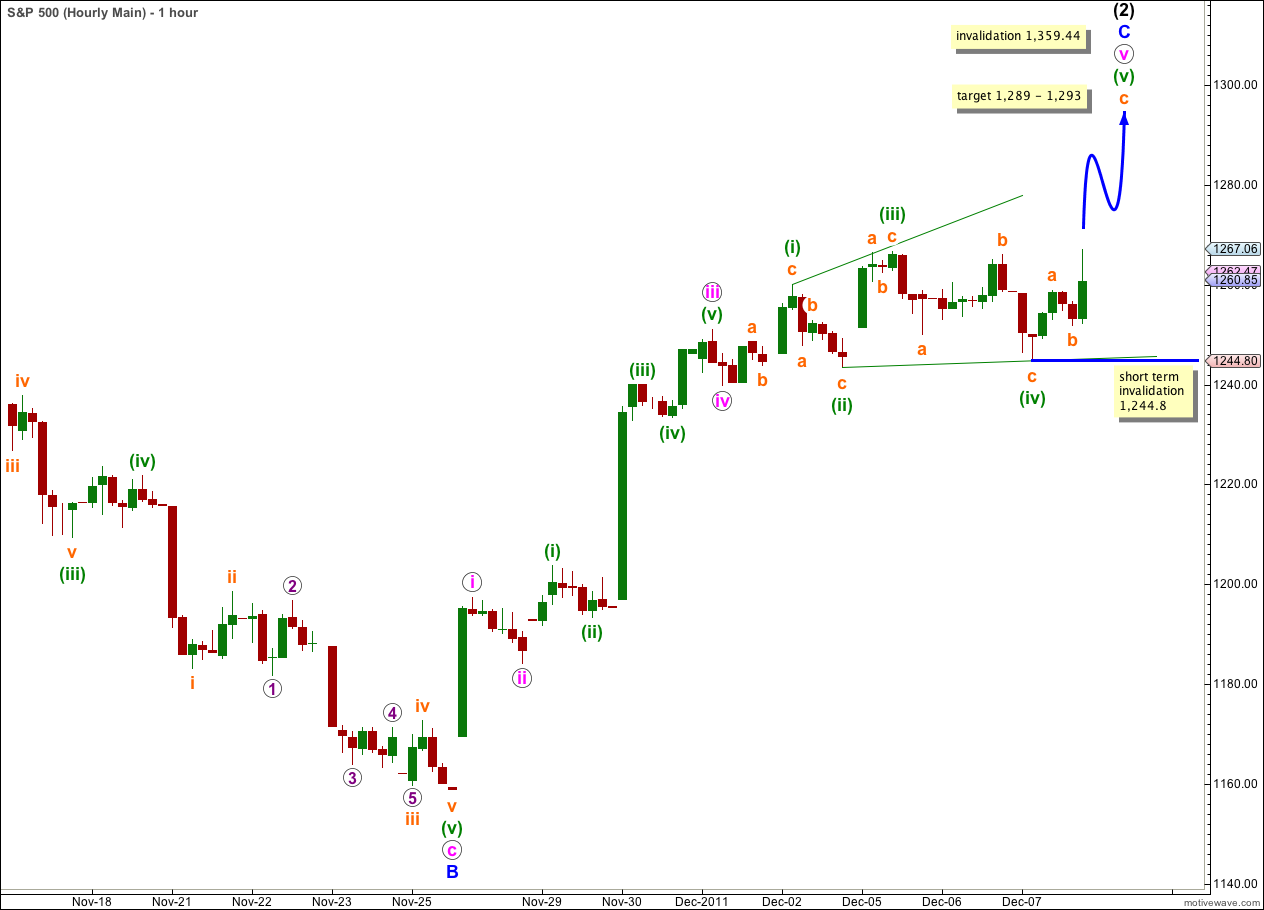
The ending diagonal for wave v pink is unfolding as expected with choppy sideways movement, trending slightly upwards.
Within waves (i), (ii), (iii) and (iv) green zigzags there are no Fibonacci ratios between any orange a and c waves. This is actually reasonably typical. We may not see a Fibonacci ratio either between waves a and c orange within wave (v) green zigzag. At 1,289 wave c orange would reach 2.618 the length of wave a orange, this target has a low probability.
Price has remained above the invalidation point at 1,243.35. At this stage the probability that wave (iv) green is complete is very high. It is now longer than wave (ii) green and the diagonal is expanding. Wave (v) green is very likely to be at least as long as wave (iii) green, if not longer. It would reach equality with wave (iii) green at 1,268.18.
Within wave (v) green wave b orange may not move beyond the start of wave a orange. In the short term this wave count would be invalidated with movement below 1,244.8.
At this stage the structure is very close to completion. Wave (v) green has moved very slightly above the end of wave (iii) green avoiding a truncation. Upwards movement could be over here, or it could continue upwards a little further for one or two more sessions.
Movement below the invalidation point at 1,244.8 will be the first indication that we have had a trend change.
Alternate Wave Count.
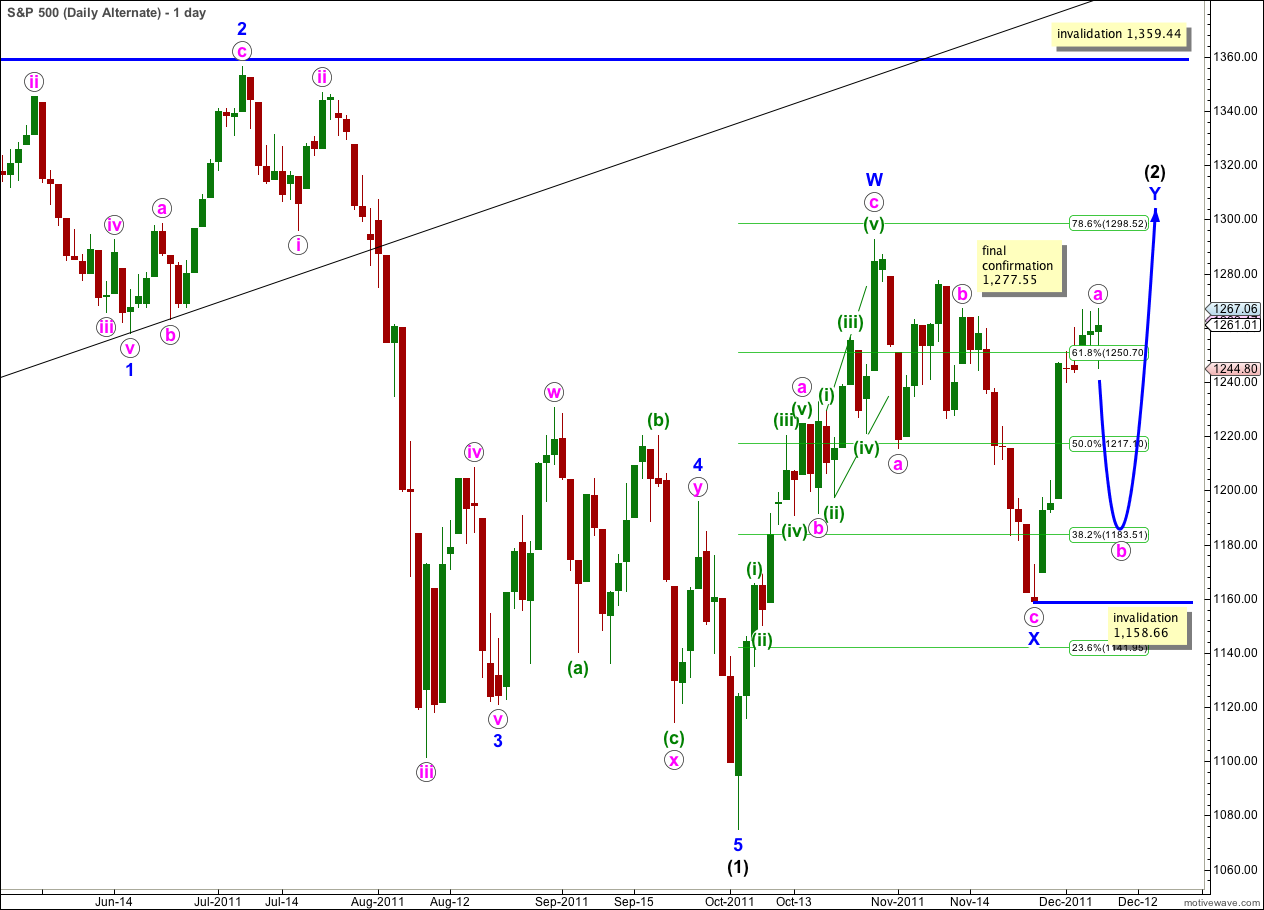
At this stage wave a pink is either already complete, or very close to it.
This wave count expects downwards movement from here for wave b pink which should unfold as a three wave structure, or a triangle. Thereafter, wave c pink should take price to a new high above the end of wave a pink, and highly likely also above the high for wave W blue at 1,292.66.
When wave b pink is complete we may use the Fibonacci ratio between waves a and c pink within wave Y blue to calculate a target for upwards movement to end.
This alternate wave count sees a continuation of overall upwards movement for another 2 to 3 weeks before the third wave down begins.
Wave b pink may not move beyond the start of wave a pink. This alternate is invalidated with movement below 1,158.66.
Second Alternate Wave Count.
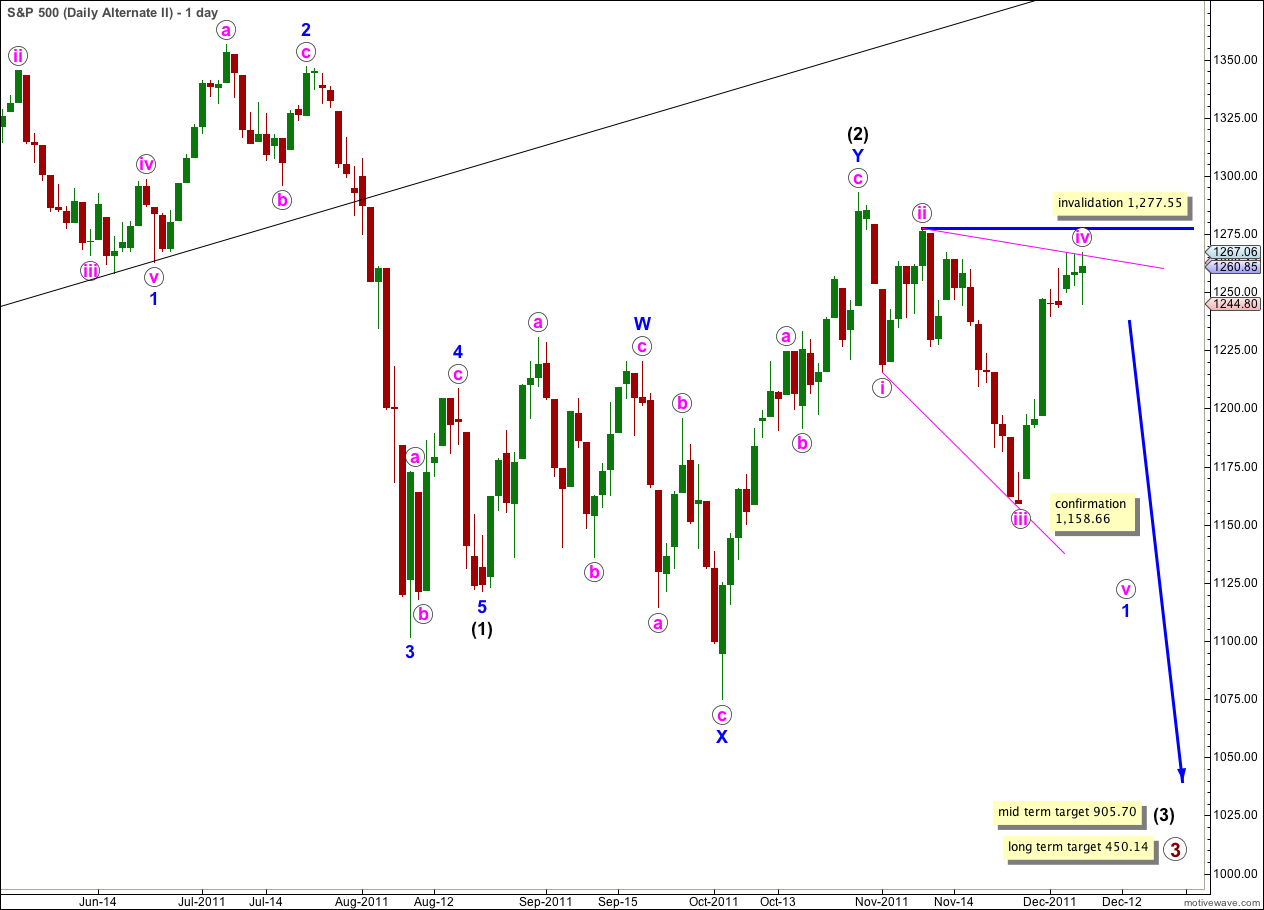
I have moved the possible leading diagonal up one degree. This may be wave 1 blue within wave (3) black. With this change this wave count has an even better look.
At this stage the only problem with this wave count is the structure of wave iv pink. For a leading diagonal subwaves 1 and 4 must be zigzags and wave iv pink is clearly an impulse and not a zigzag. This wave count requires a little further upwards movement for wave iv pink to develop a corrective wave count for it to be valid, or alternately a downwards b wave followed by a c wave to make a slight new high.
Wave iv pink may not move beyond the end of wave ii pink. This wave count is invalidated with movement above 1,277.55.