
Elliott Wave chart analysis for the S&P 500 for 5th December, 2011. Please click on the charts below to enlarge.
Price has moved higher in line with expectations for this main wave count. A very little movement above 1,266.36 has provided some confirmation for this wave count.
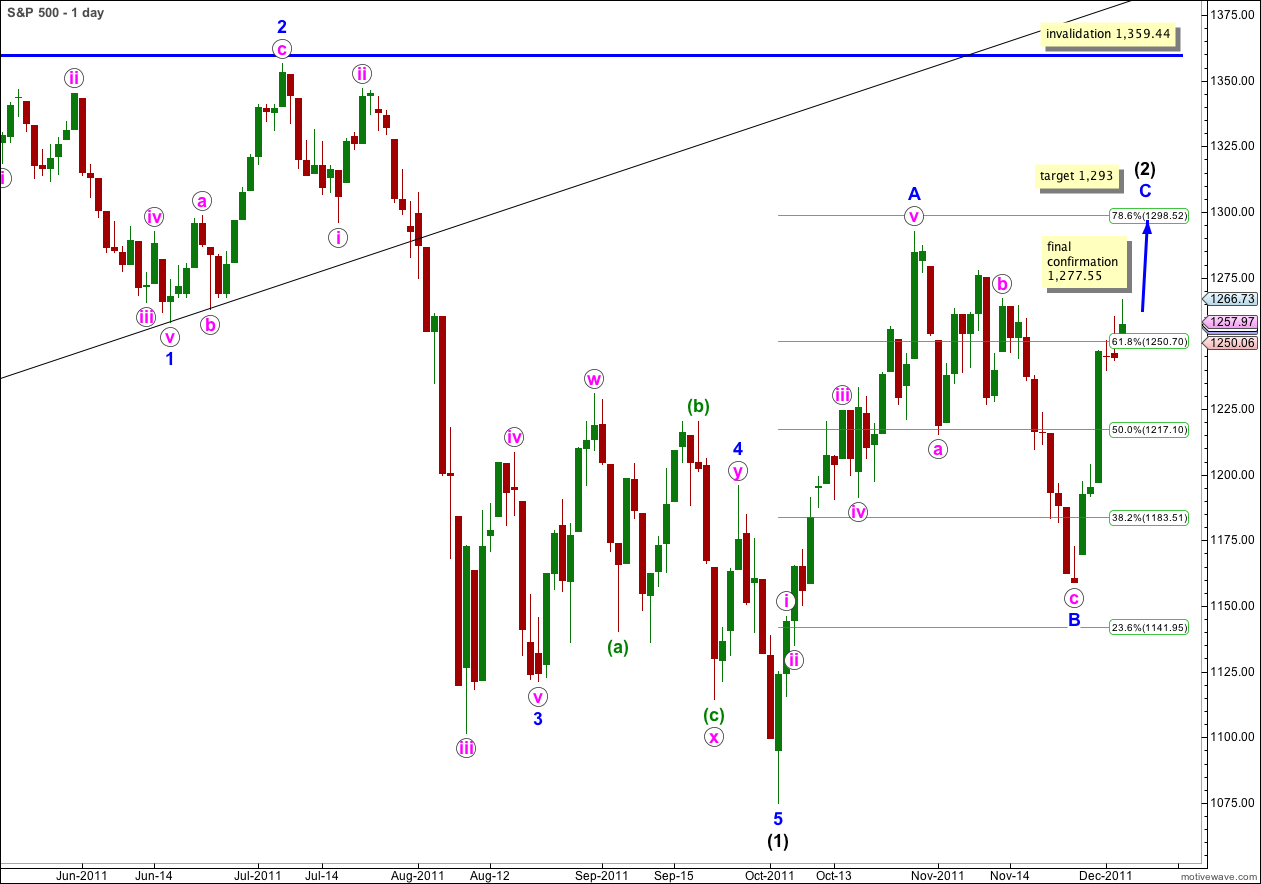
Wave (2) black is here unfolding as a large zigzag structure. So far it looks like it is in proportion to wave (1) black which lasted 102 days. Wave (2) so far has taken 37 days so it would be likely that it is not over yet.
If this wave count is correct then movement above 1,292.66 would be highly likely and wave C blue would avoid a truncation.
At 1,293 wave C blue would reach 0.618 the length of wave A blue.
Wave (2) black may not move beyond the start of wave (1) black. This wave count is invalidated with movement above 1,359.44.
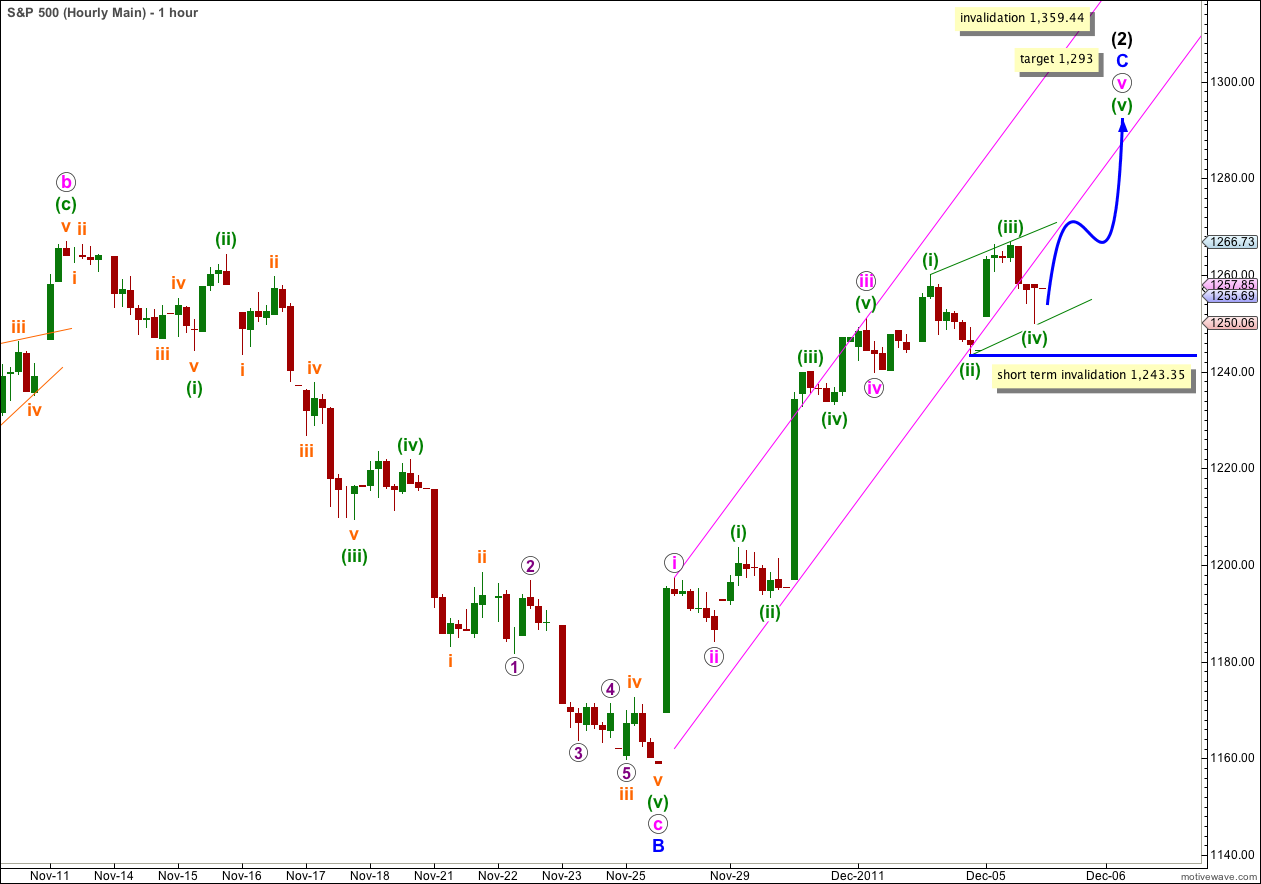
Price has continued higher in choppy overlapping movement which fits for this wave count.
If this wave count is correct then tomorrow we should see further upwards movement to at least 1,273 and most likely higher. If the diagonal is expanding wave (v) green should be longer than wave (iii) green and it reaches equality with wave (iii) green at 1,273. However, the diagonal may be contracting but with a third wave which is still the longest. Price may fail to reach 1,273.
Wave C blue does not have to move beyond the end of wave A blue at 1,292.66 but it is highly likely that it would.
Wave (iv) green of the possible ending diagonal has overlapped wave (i) green price territory as it should. It may not move beyond the end of wave (ii) green. This wave count is invalidated with movement below 1,243.35.
Alternate Wave Count.
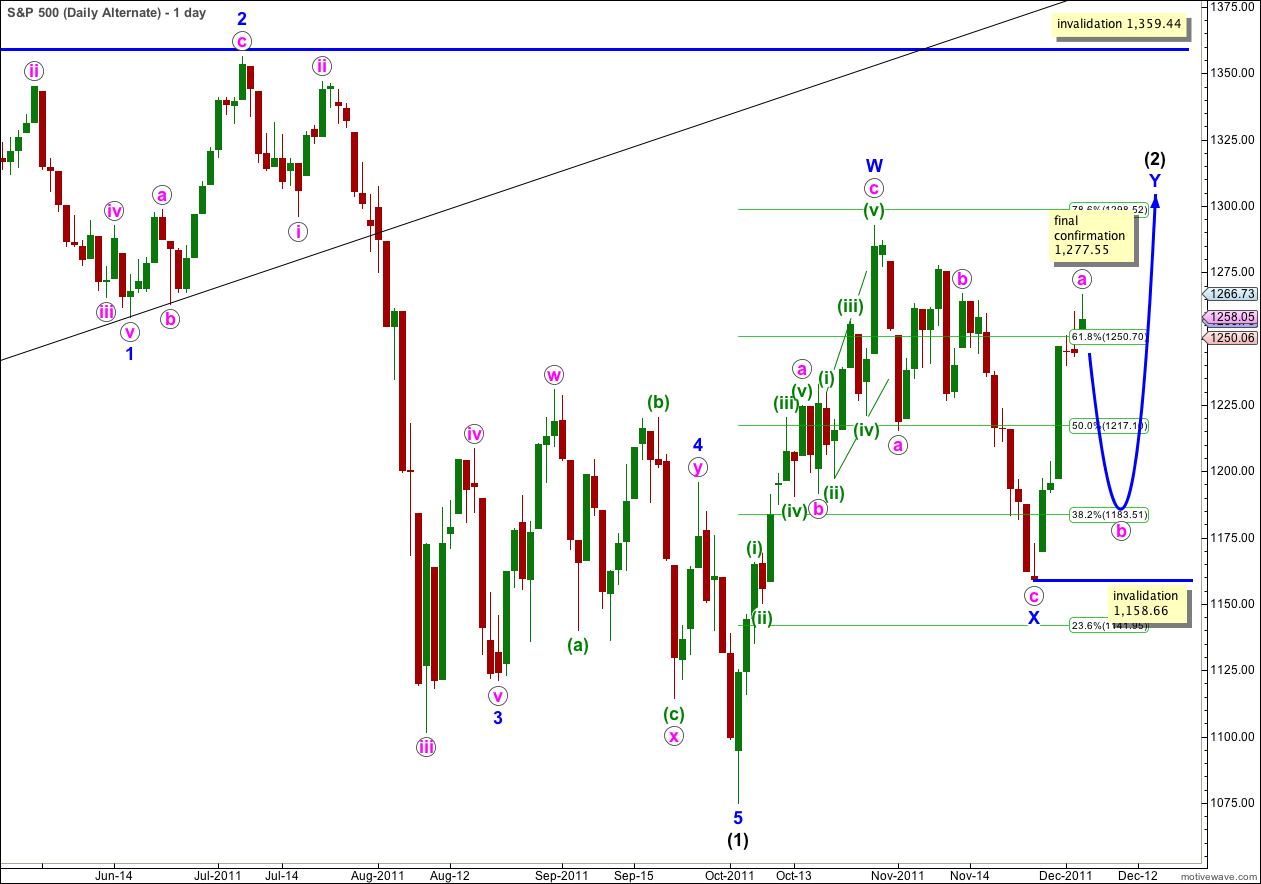
If price fails to reach above 1,292.66 and turns back downwards then this will be my preferred wave count, it would have the best look.
Wave (2) black may be unfolding as a double zigzag or double combination structure. If wave Y blue is a double zigzag, and wave a pink within it is a five wave impulse so a zigzag is most likely, then wave b pink may not move beyond the start of wave a pink. This wave count is invalidated with movement below 1,158.66.
Wave Y blue could still unfold as a triangle as one of the five subwaves of a triangle does not have to subdivide into a zigzag and wave a of the triangle could subdivide into an impulse. If wave Y blue was a running triangle then wave b may make a new low below the start of wave a. However, the probability of a triangle unfolding in this manner is very low. I will only chart it and use this idea if it shows itself to be correct. So far wave a does not look like a typical start for a triangle.
Second Alternate Wave Count.
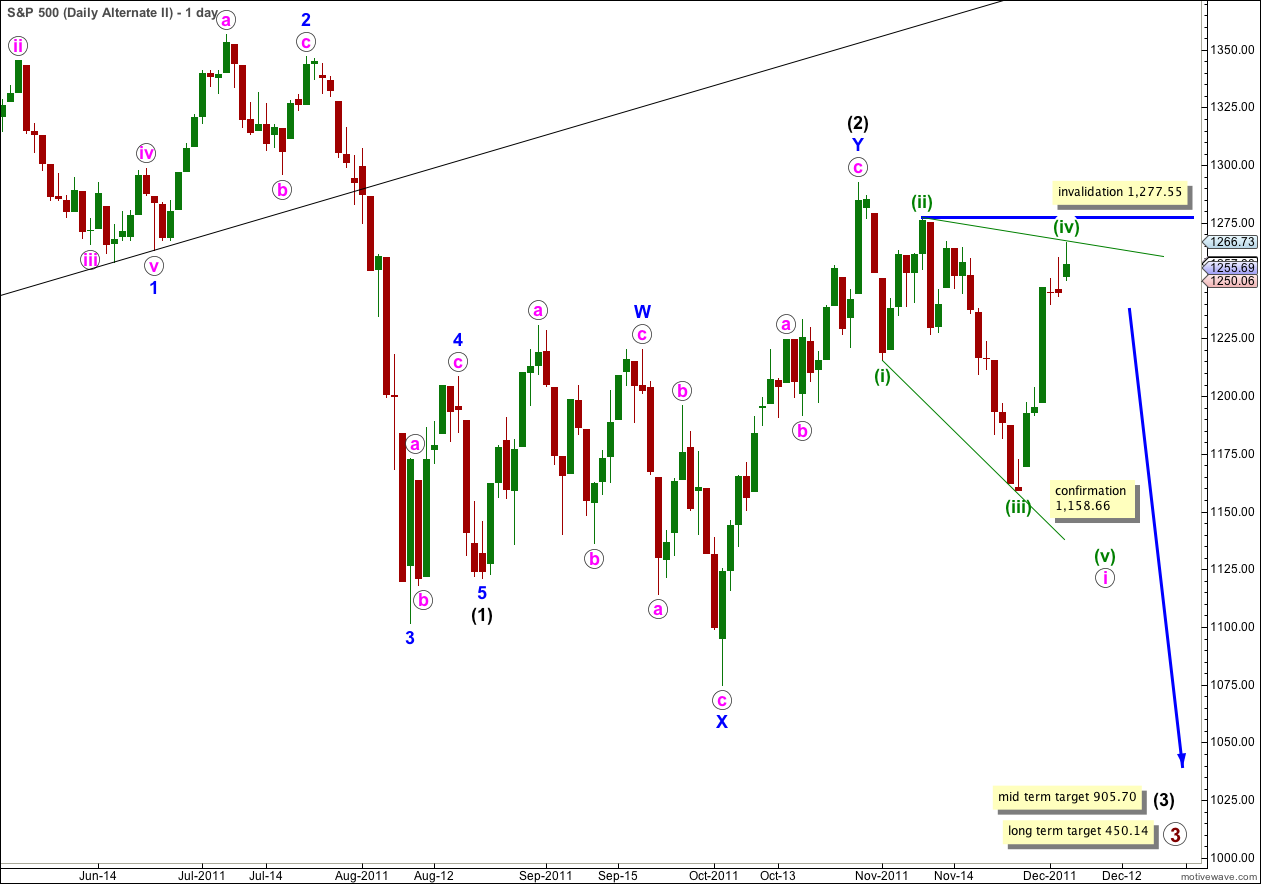
Movement above 1,266.36 invalidated our last second alternate wave count.
Wave i pink within wave 1 blue may be unfolding as a leading expanding diagonal. All the subdivisions fit well here, and the problem of having large sub minuette waves labelled on the daily chart is removed.
The diagonal is expanding and so if wave (v) green begins here at 1,148 it would reach equality with wave (iii) green, this would be fairly likely. However, the diagonal may yet have a third wave which is still the longest so this price point may not be met.
A leading diagonal may not have a truncated fifth wave and for this wave count to remain valid we must see movement to a new low below the low of (iii) green at 1,158.66. This would also invalidate the main wave count and provide us with clarity.
Following a leading diagonal in a first wave position we should expect a very deep second wave correction. If this wave count is confirmed we will expect wave ii pink to reach about 0.786 of wave i pink.
Wave (iv) green of this diagonal may not move beyond the end of wave (ii) green. This wave count is invalidated with movement above 1,277.55.
Thank you to Jon Legett, a member of EWSM, for pointing out this possibility to me.