
Elliott Wave chart analysis for the S&P 500 for 2nd December, 2011. Please click on the charts below to enlarge.
The S&P 500 moved slowly higher to end the trading week. I am swapping our previous main and alternate wave counts around. This wave count now has a better overall look than what is now our alternate.
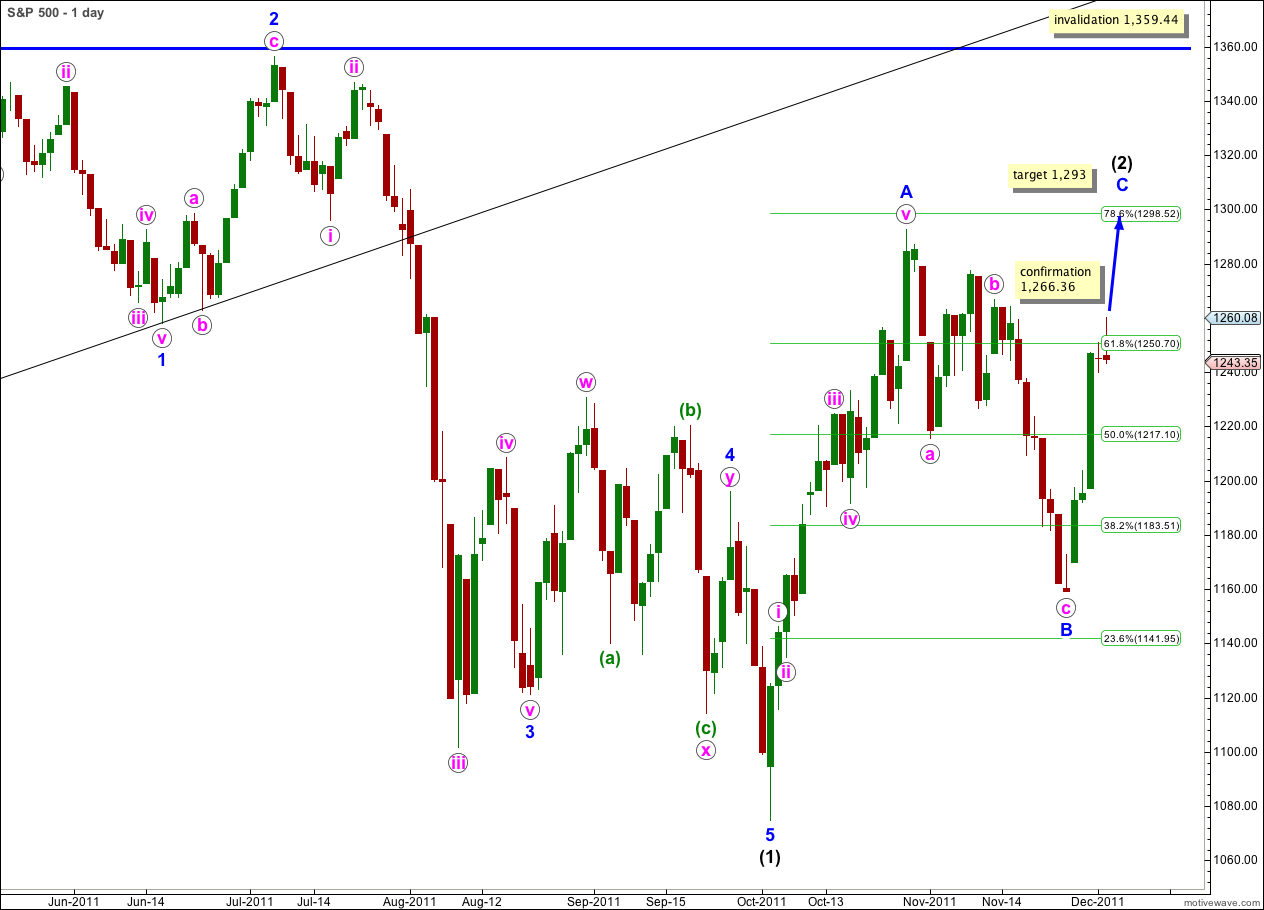
This wave count expects that wave (2) black is incomplete. Wave (2) black may be completing as a single zigzag, as per this chart above, or as a double zigzag or double combination. We must consider both possibilities. Unfortunately the upwards movement labeled A blue within (2) black is ambiguous and may be seen as either a three or a five.
At this stage wave (2) black is unfolding as a large zigzag looking structure and this will be our main wave count. Wave C blue is highly likely to make a new high above the end of A blue at 1,292.66. However, it does not have to. There may be enough downwards pull from the upcoming third wave to force a truncation.
At 1,293 wave C blue would reach 0.618 the length of wave A blue.
Wave (2) black may not move beyond the start of wave (1) black. This wave count is invalidated with movement above 1,359.44.
Movement above 1,266.36 would invalidate the alternate wave count at the end of this analysis, and at that stage we may have more confidence in this wave count.
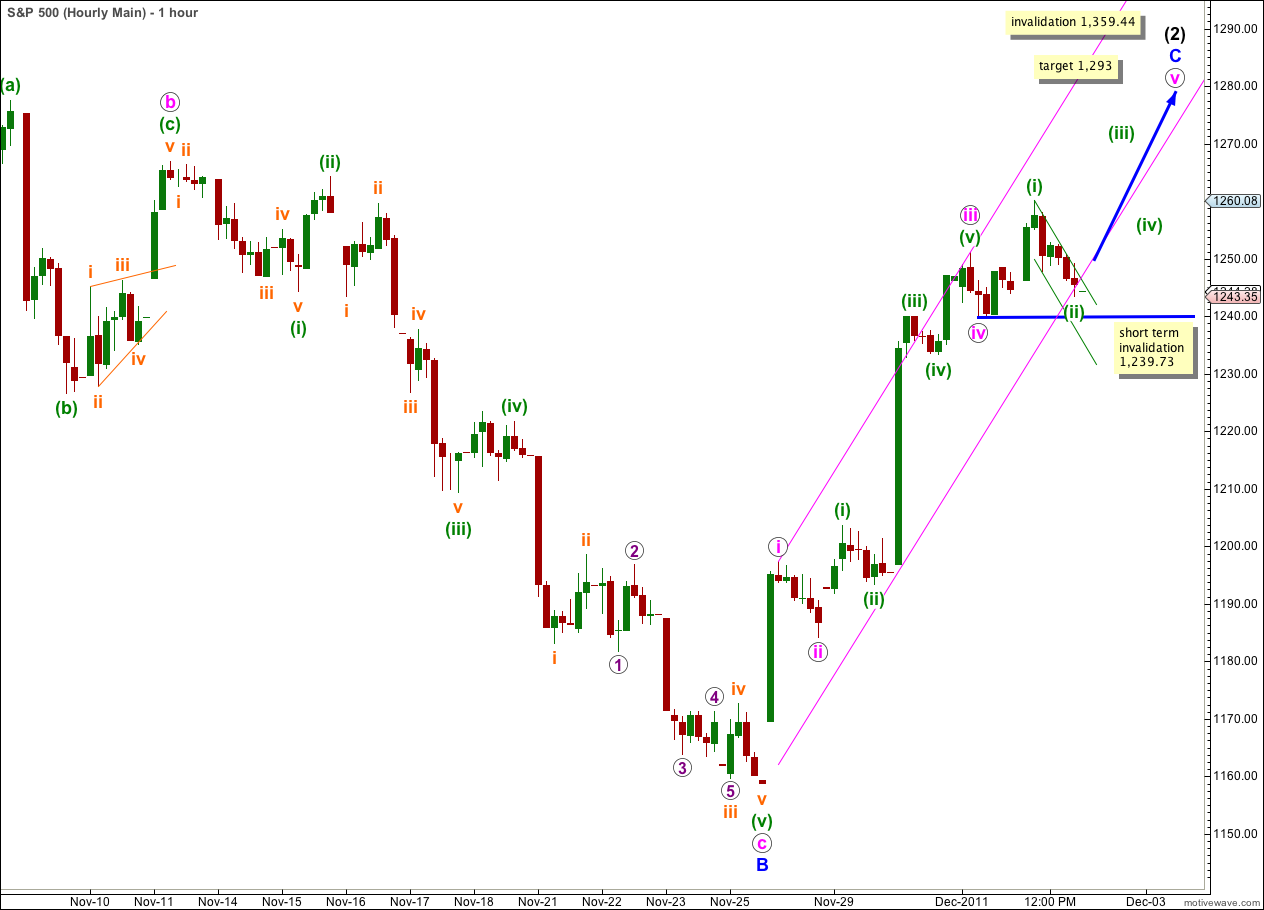
Upwards movement remains within a narrow channel and there are two impulses for i and iii pink complete. Wave v pink looks like it may be unfolding as an ending diagonal and wave (i) green to start it is a zigzag on the hourly and 5 minute charts.
This parallel channel is drawn first with a trend line from the highs of i to iii pink, and the lower trend line is placed upon the outer point within (iii) green within iii pink as a best fit.
Wave iii pink is 4.34 points longer than 1.618 the length of wave i pink. Because there is already an adequate Fibonacci ratio between waves i and iii pink we may not see a Fibonacci ratio between wave v and either of i or iii pink. We may use one degree higher, blue degree, to calculate the target.
Within the possible ending diagonal for wave v pink wave (ii) green may not move beyond the start of wave (i) green. This wave count is invalidated with movement below 1,239.73. Movement below this price point may be an early indication of a trend change.
Alternate Wave Count.
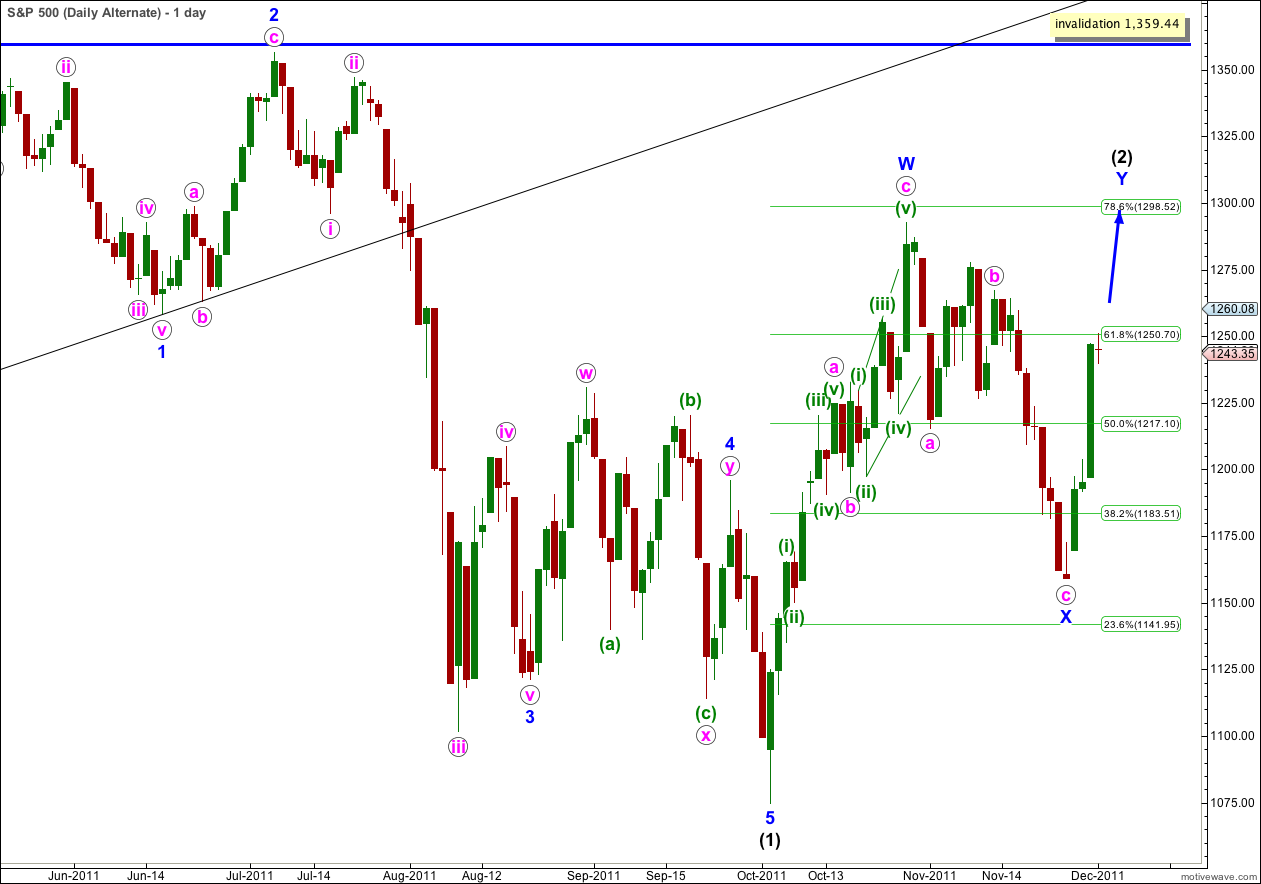
It is also possible that wave (2) black is either a double zigzag or double combination.
Wave W blue subdivides nicely into a zigzag. Wave X blue is a clear zigzag. Wave Y blue, the second structure in the double, may be either a zigzag, a triangle or a flat correction. At this stage a flat correction looks unlikely and a zigzag looks like the most likely possibility.
For this alternate, especially if (2) black is a double zigzag, it is highly likely that wav Y blue will make a new high above 1,292.66.
Within wave Y blue we would not yet have the end of wave a pink. This would be unfolding as a five wave impulse on the hourly chart, and the final fifth wave would be unfolding as per the hourly chart for the main wave count (with labeling moved down one degree).
When we have the end of waves a and b pink we may use the ratio between waves a and c pink to calculate a target for wave Y blue to end. We cannot do that at this stage.
Wave (2) black may not move beyond the start of wave (1) black. This wave count is invalidated with movement above 1,359.44.
If the short term invalidation point at 1,239.73 is breached on Monday then this alternate wave count would be the most likely explanation. At that stage we may expect downwards movement to be wave B within wave Y blue. Wave B may not move beyond the start of wave A and so at that stage the invalidation point would move down to 1,158.66. Wave b pink within Y blue should take about 2 – 3 days and must subdivide into a three.
Alternate I Wave Count.
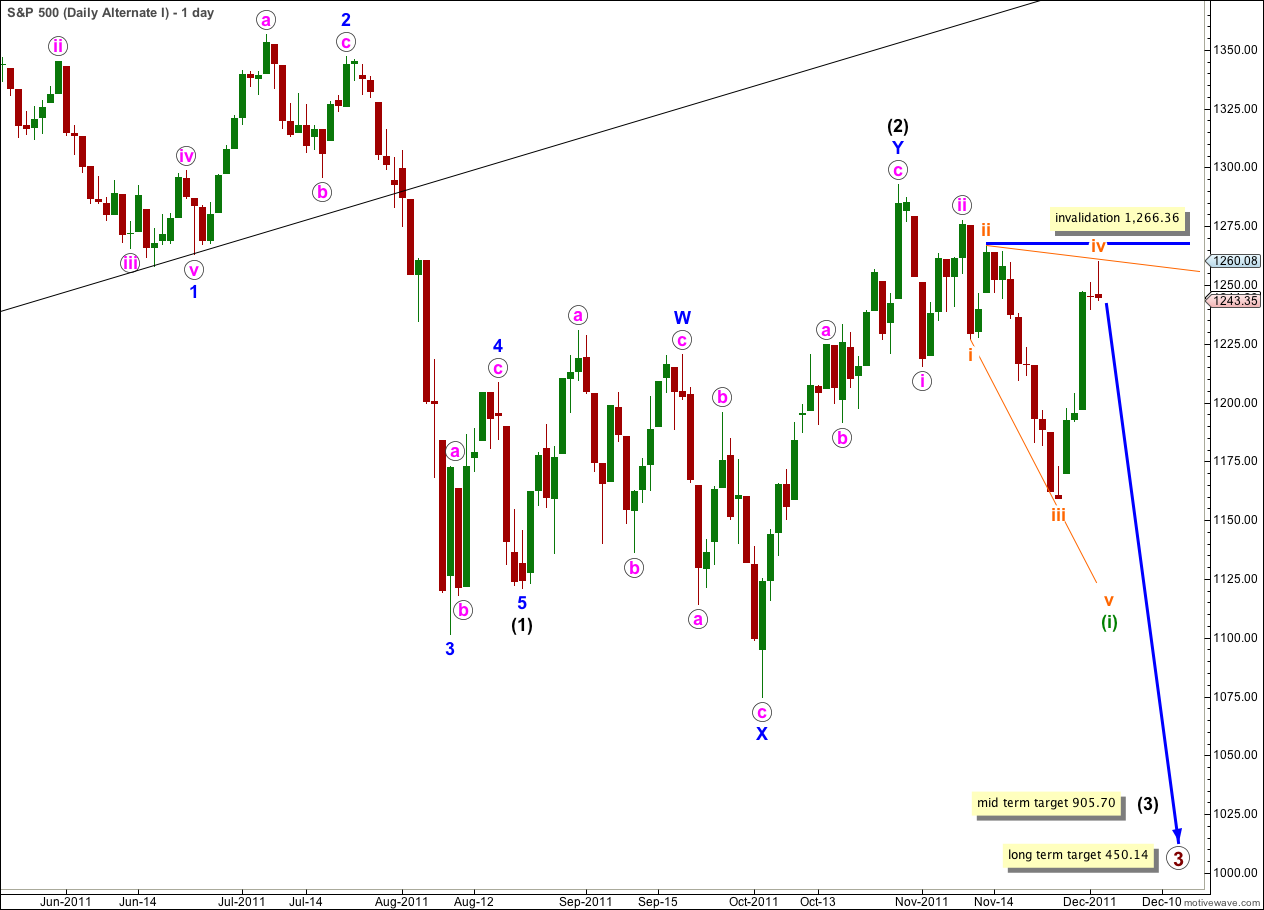
This was up to last analysis our main wave count. The size of subminuette (orange) degree waves showing up on the daily chart is giving this wave count a slightly strange look. I will make a judgement call that this wave count now has a lower probability than what is now our main wave count.
If wave (2) black is complete then wave (3) black is still within wave 1 blue. Within wave 1 blue wave i pink is complete, and wave iii pink is beginning with a leading expanding diagonal in the first wave position.
Within a diagonal wave iv orange may not move beyond the end of wave ii orange. This wave count is invalidated with movement above 1,266.36.
I will not present the other alternate possibility that we were charting last analysis as it is just too many charts to consider. For the idea that wave (2) black is over we really only need one wave count. The invalidation point is the same anyway.