
Elliott Wave chart analysis for the S&P 500 for 30th November, 2011. Please click on the charts below to enlarge.
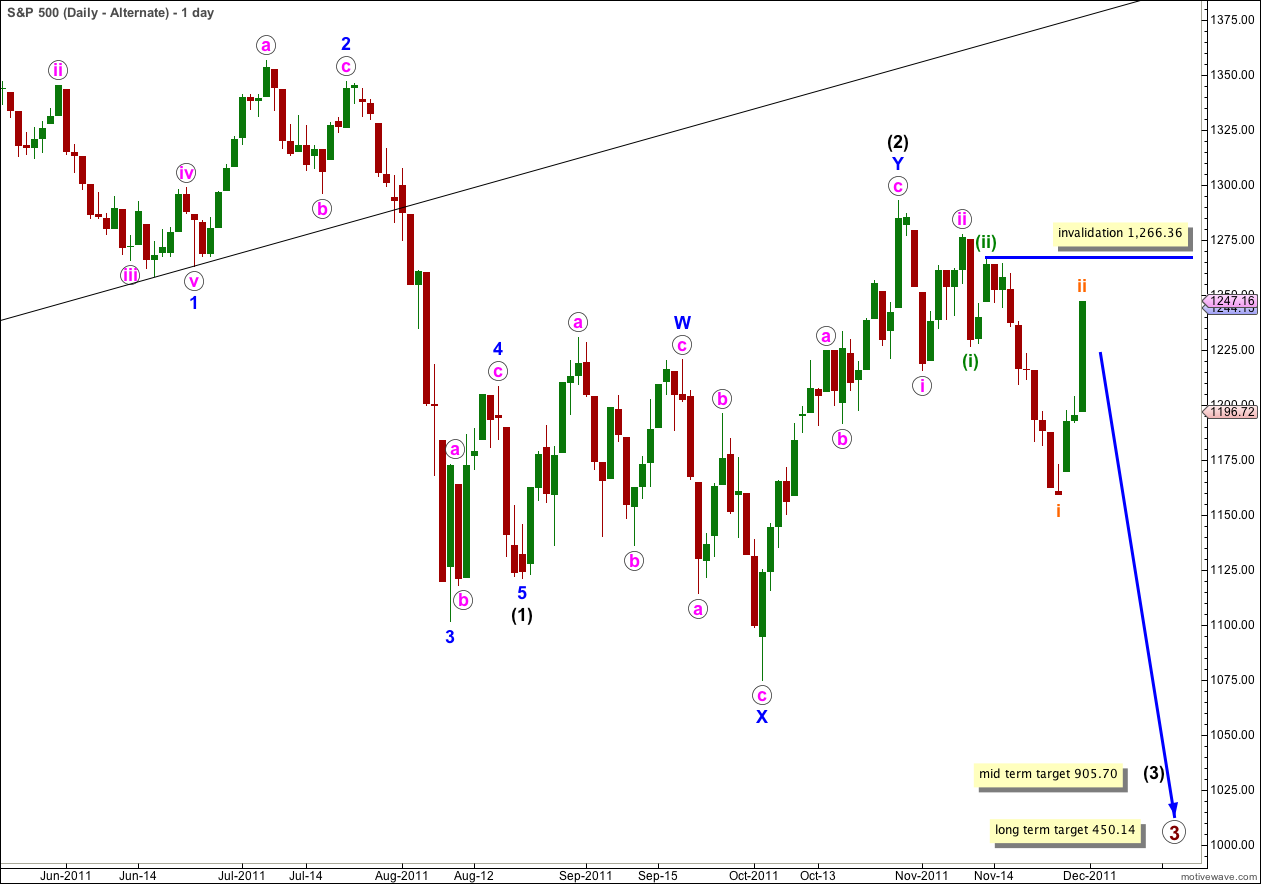
Strong upwards movement has invalidated all of our wave counts except the outlying alternate daily wave count. This has necessitated a reanalysis of all recent movement.
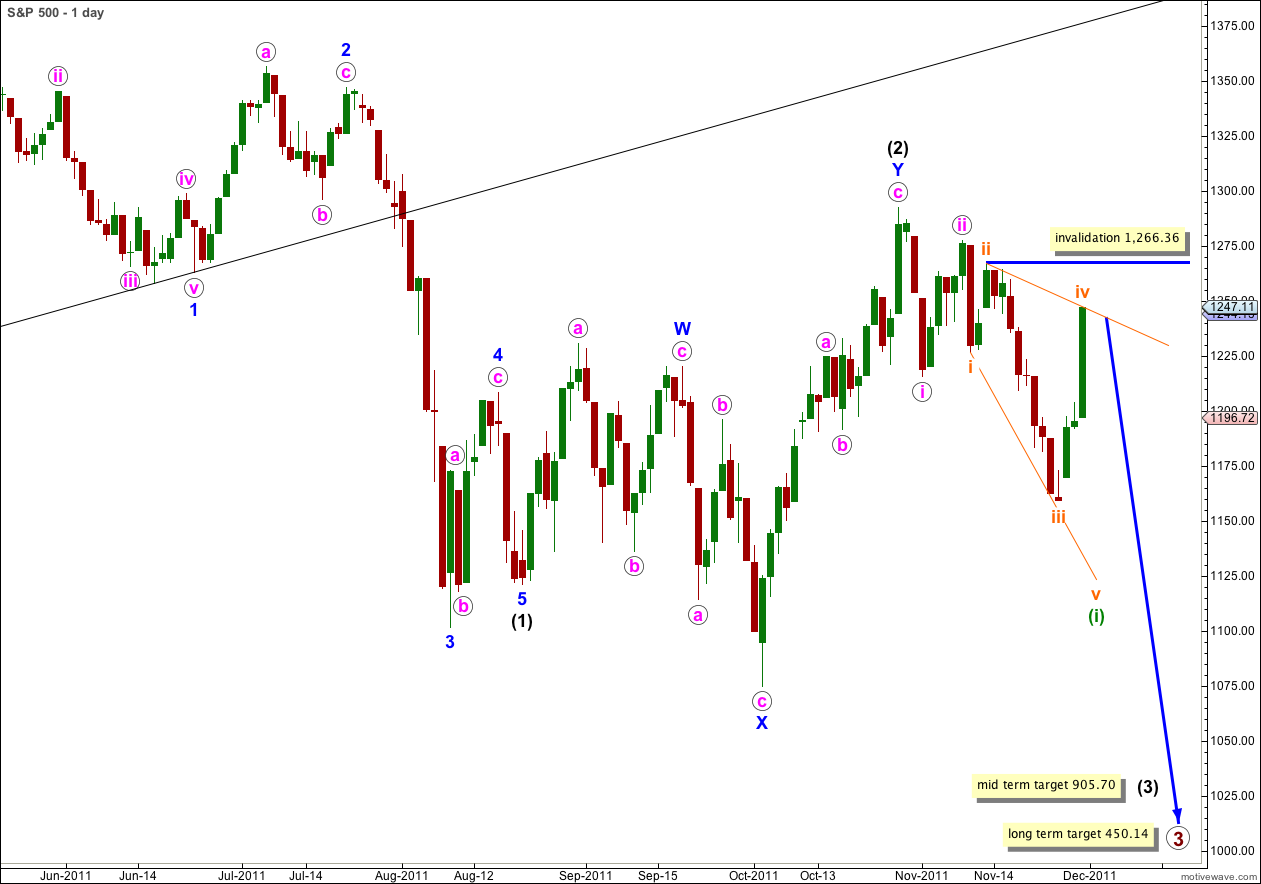
With the fourth wave now overlapping into wave 1 price territory the next possibility to consider is a diagonal. In this position it must be a leading diagonal for wave (i) green.
This leading diagonal still requires the final fifth wave downwards and for a leading diagonal the fifth wave may not be truncated so it must make a new low below 1,162.57.
When wave (i) green is a complete five wave structure we would expect a very deep correction.
Wave iv orange may not move beyond the end of wave ii orange. This wave count is invalidated with movement above 1,266.36.
I have taken another look at the monthly chart and am trying to see a wave count where wave (1) black ends at the low labeled here X blue. If I manage to see a wave count which allows for this it would explain the upwards movement nicely, and we would expect a new high above the high labeled (2) black on the chart above. If I can see a satisfactory wave count, where all the subdivisions fit, I will publish it for us.
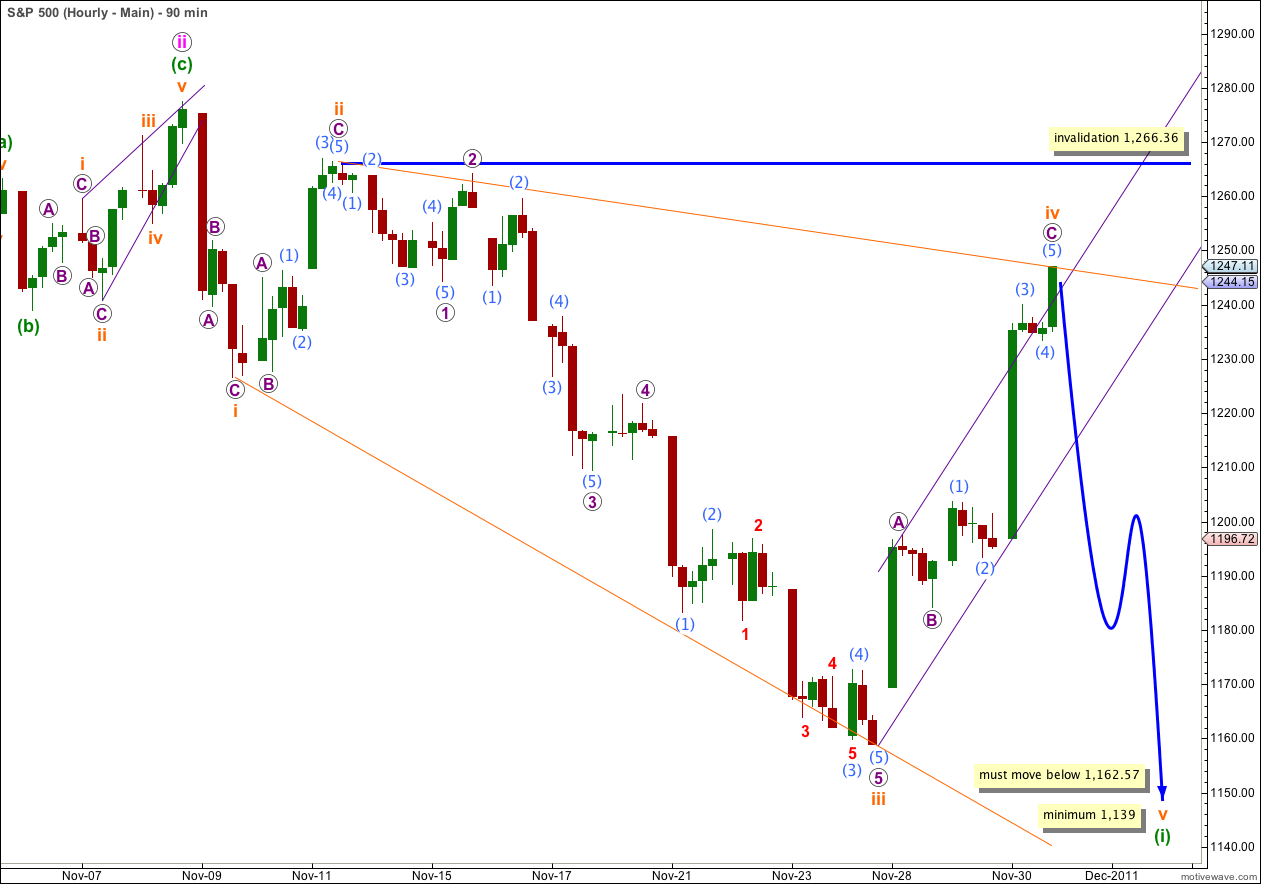
The hourly chart shows all of the structure of wave (i) green leading expanding diagonal.
This wave count has a good fit. It sees the downwards movement labeled i orange as a zigzag. A leading diagonal should have waves 2 and 4 as zigzags. Waves 1, 3 and 5 are commonly zigzags but may also be impulses. If one of these three actionary waves is to be an impulse it is often the third wave.
We should expect wave v orange to most likely be a zigzag.
A leading diagonal may not have a truncated fifth wave. Wave v orange must take price below 1,162.57 for this structure to remain valid.
The diagonal is expanding. Wave iii orange is longer than wave i and wave iv orange is longer than wave ii. We would expect wave v orange to be longer than wave iii orange. It would reach equality with wave iii orange at 1,139. However, I do often see diagonals where the third wave is still the longest so price may not make it down this far.
For a diagonal the fourth wave should overlap into wave one price territory. Wave iv orange may not move beyond the end of wave ii orange. This wave count is invalidated with movement above 1,266.36.
Alternate Wave Count.
Alternately we may have had a series of first and second overlapping waves.
Wave ii orange however is very large for a subminuette wave and this reduces the probability of this wave count.
This alternate sees the downwards movement labeled (i) green as a five wave structure. This is possible, if it had a slightly truncated fifth wave, but it does not fit as well as the main wave count which sees this movement as a three. This reduces the probability of this wave count also.
Wave ii orange may not move beyond the start of wave i orange. This wave count is invalidated with movement above 1,266.36.
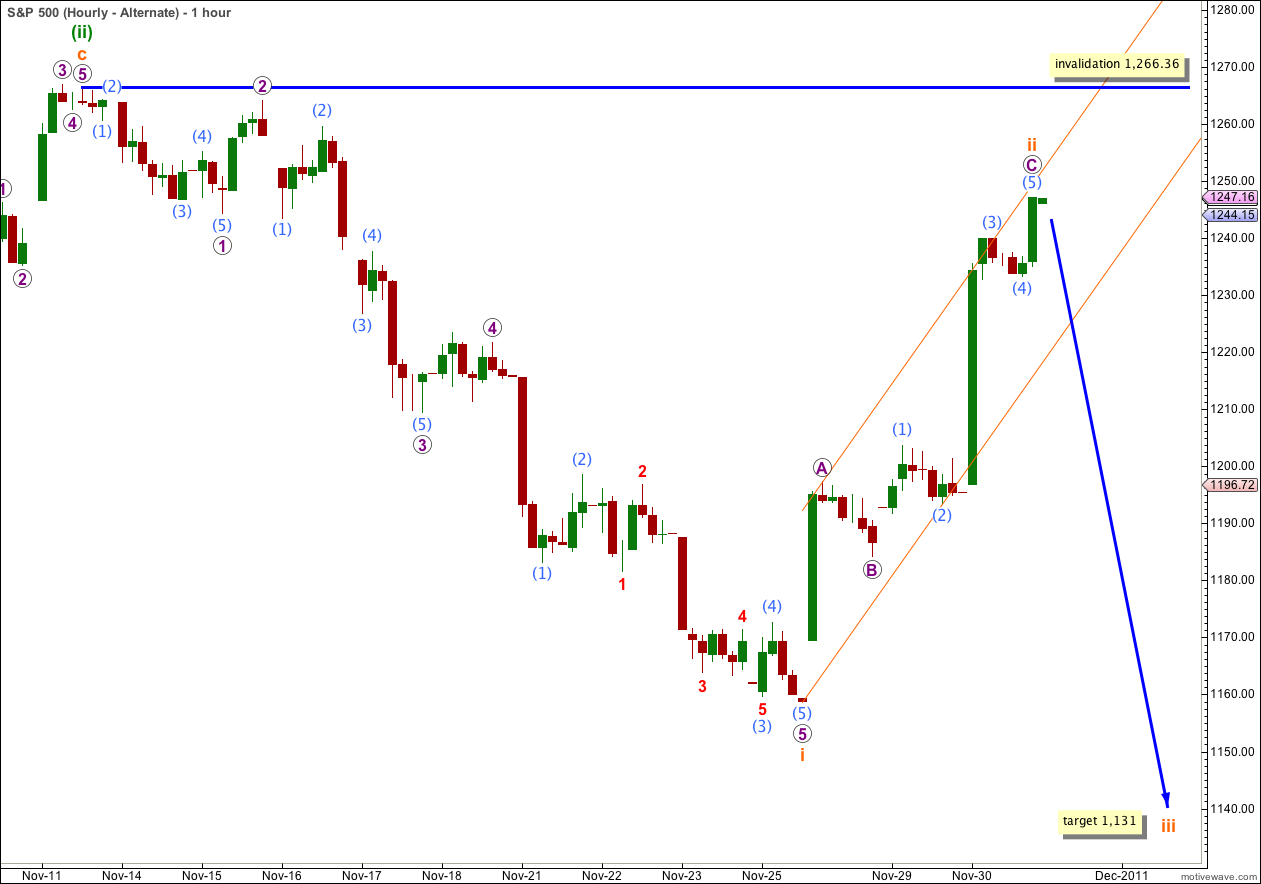
The hourly chart shows only the structure of waves i and ii orange.
We should use a parallel channel about wave ii orange zigzag (this is drawn here as a best fit) to tell us when upwards movement is over. When we see a clear breach of this trend channel we shall have some confirmation that the upwards movement, no matter what it is labeled, is over, and the next wave down is underway.
Wave iii orange would reach 1.618 the length of wave i orange at 1,131.
Wave iii orange must make a new low beyond the end of wave i orange, so like the main wave count this alternate requires a new low.
Second Alternate Wave Count.
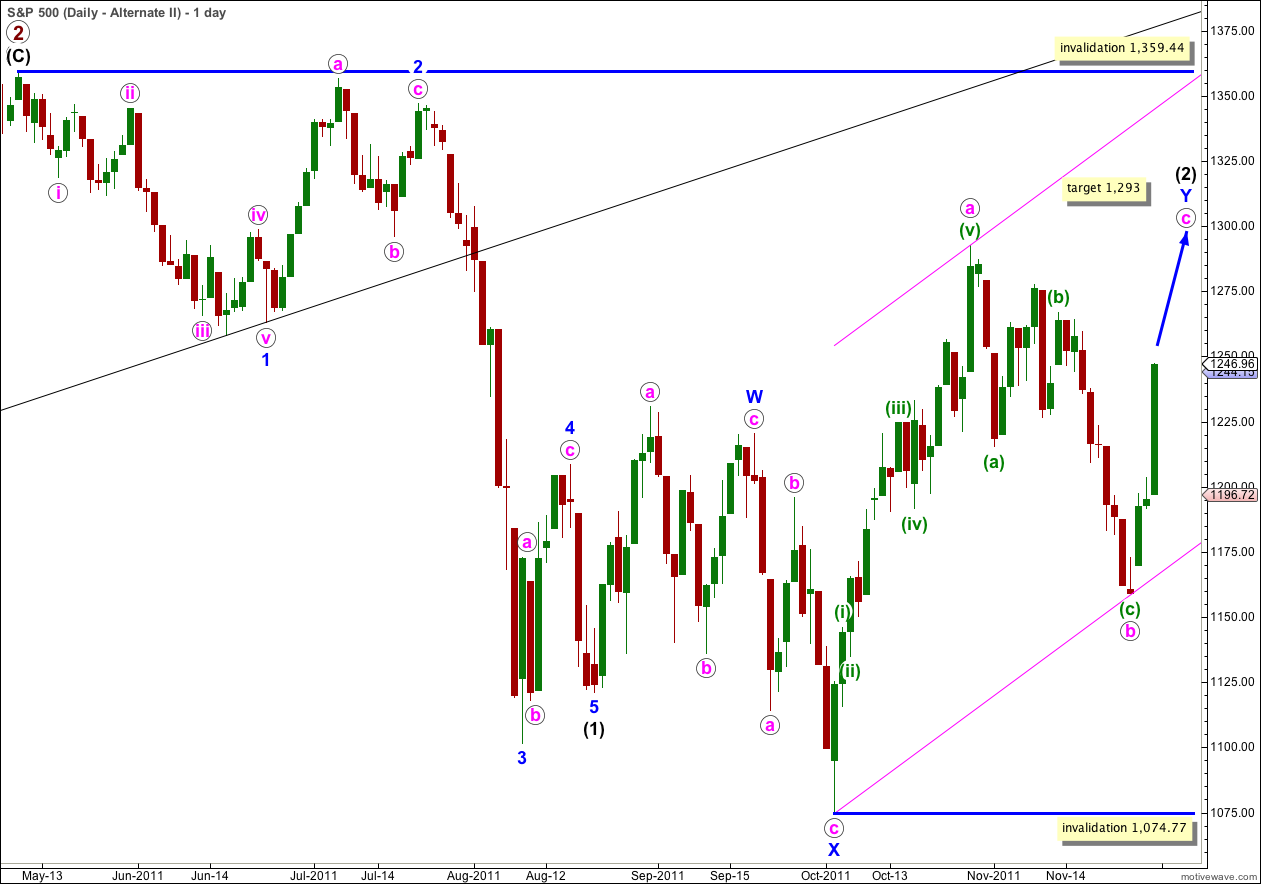
This wave count still looks very unlikely, but it does explain Wednesday’s strong upwards session. It remains a technical possibility and the probability is very low. At 1,293 wave c pink would reach 0.618 the length of wave a pink. It is extremely likely, if this wave count is correct, that wave c would make a new high beyond the high labeled a pink.