
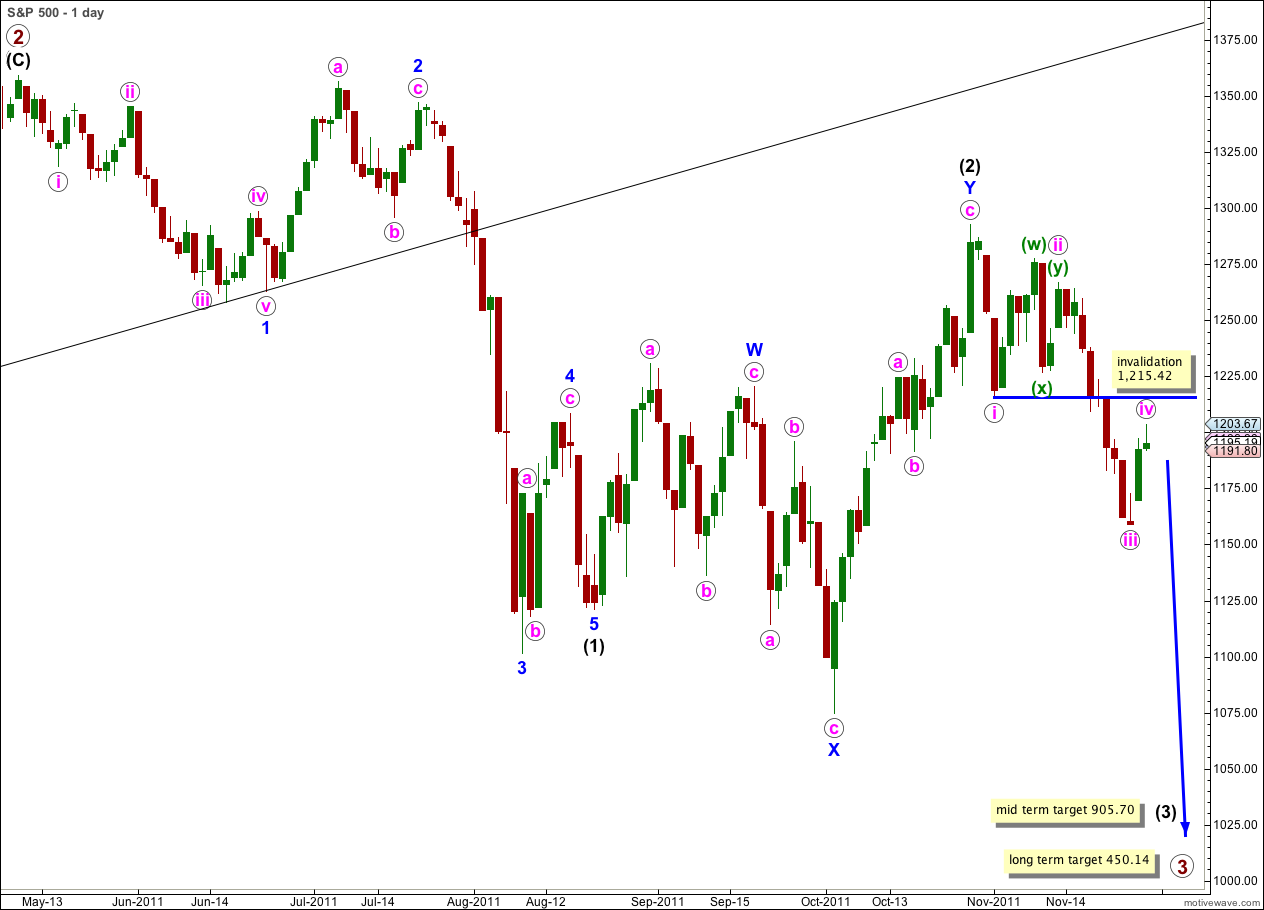
Elliott Wave chart analysis for the S&P 500 for 29th November, 2011. Please click on the charts below to enlarge.
We did not see a little downwards movement which was expected to begin Tuesday’s session and price has moved higher to complete a zigzag structure on the hourly chart.
Wave iv pink is most likely underway and it should take another 4 to 7 days to unfold.
We have two hourly charts for this main wave count. I also have a new alternate daily and hourly chart for you which sees the correction as just over.
Wave iv pink may not move into wave i pink price territory. This wave count is invalidated with movement above 1,215.42.
Main Hourly Wave Count.
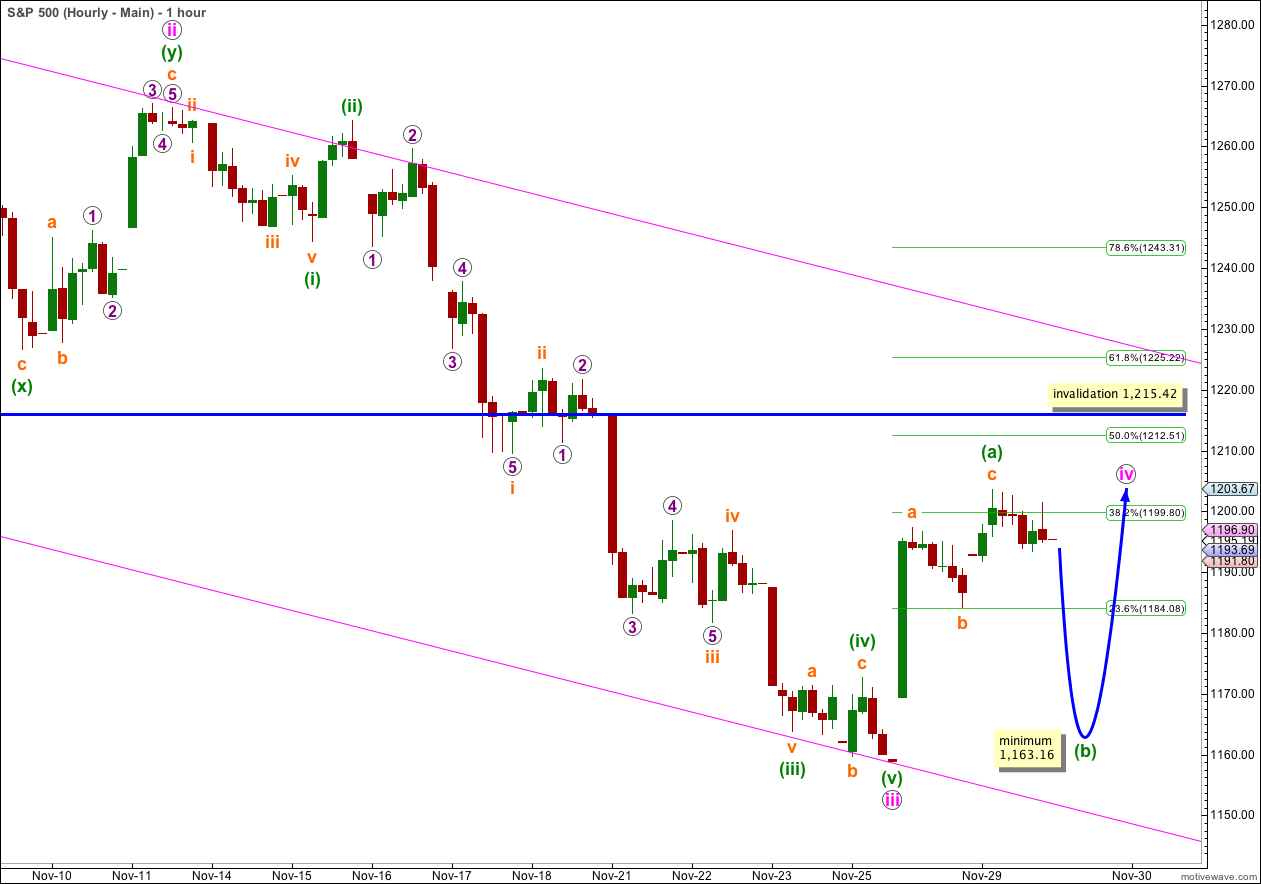
Wave iv pink may be unfolding as a flat or as a triangle, where wave (a) green within it subdivides into a three wave zigzag.
If wave iv pink is a flat correction then wave (b) green must reach at least 90% of wave (a) green. This gives us a minimum expectation for downwards movement to reach at least 1,163.16. If wave (b) green fails to reach this minimum then a triangle could be more likely.
Within an expanded flat or running triangle wave B may make a new price extreme beyond the start of wave A. Thus there is no lower invalidation point for this wave count as wave (b) green may make a new low below 1,158.66. Expanded flat corrections are very common and they require wave B to be at least 105% the length of wave A, so a new low is fairly likely.
Wave iv pink may not move into wave i pink price territory. This wave count is invalidated with movement above 1,215.42.
Alternate Hourly Wave Count.
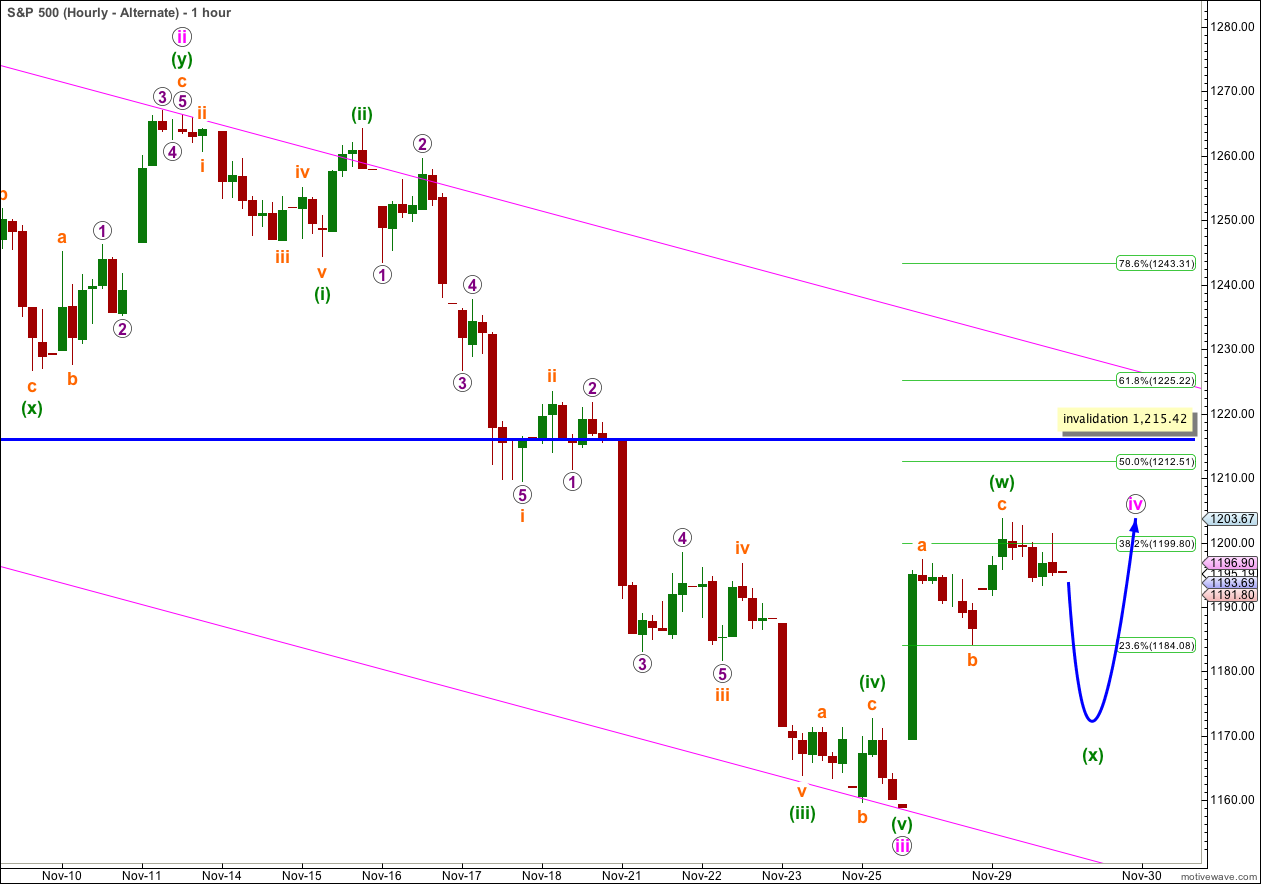
Wave iv pink may be unfolding as a double combination correction. Wave (w) green would be complete as a zigzag, and wave (x) green downwards has no minimum requirement and no lower invalidation point as it may make a new low below 1,158.66.
Wave (y) green would most likely be a flat or a triangle. It would be unlikely to be a zigzag.
Wave iv pink may not move into wave i pink price territory. This wave count is invalidated with movement above 1,215.42.
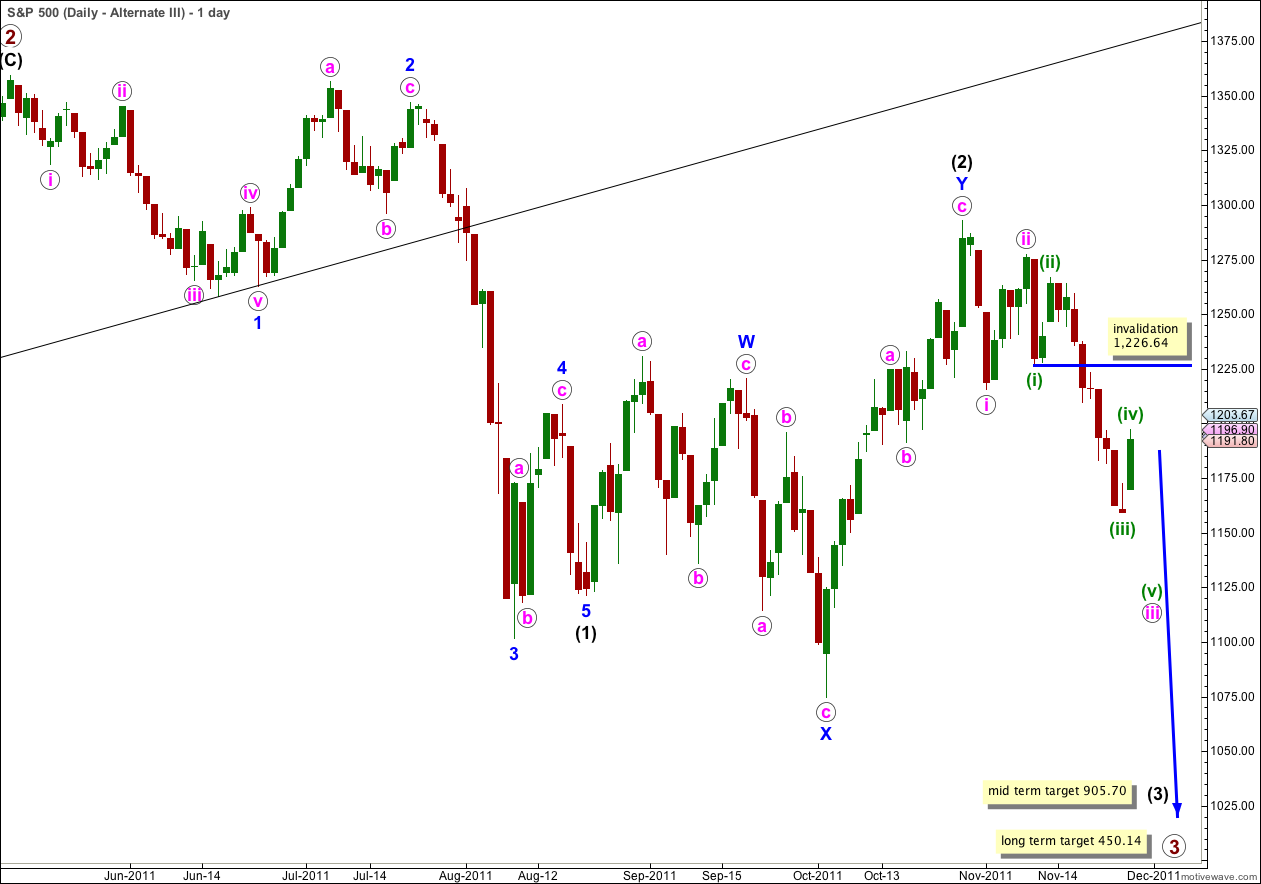
Alternate Wave Count.
I have taken another look at the downwards movement here labeled (i) green within wave iii pink on a five minute chart and if wave (i) green ended with a slightly truncated fifth wave it is possible to see this downwards movement as a five instead of a three.
This wave count has a very typical look on the daily chart. If the main wave count is invalidated with a little movement above 1,215.42 then this alternate would be an excellent explanation. If that occurs the invalidation point should move up to 1,226.64.
For this wave count waves (ii) and (iv) green are in proportion, and it would be likely that the upwards movement is over for now.
This wave count requires one more downwards wave for wave (v) green to complete wave iii pink. Thereafter, wave iv pink would begin and should take price sideways for over a week.
Wave (iv) green may not move into wave (i) green price territory. This wave count is invalidated with movement above 1,226.64.
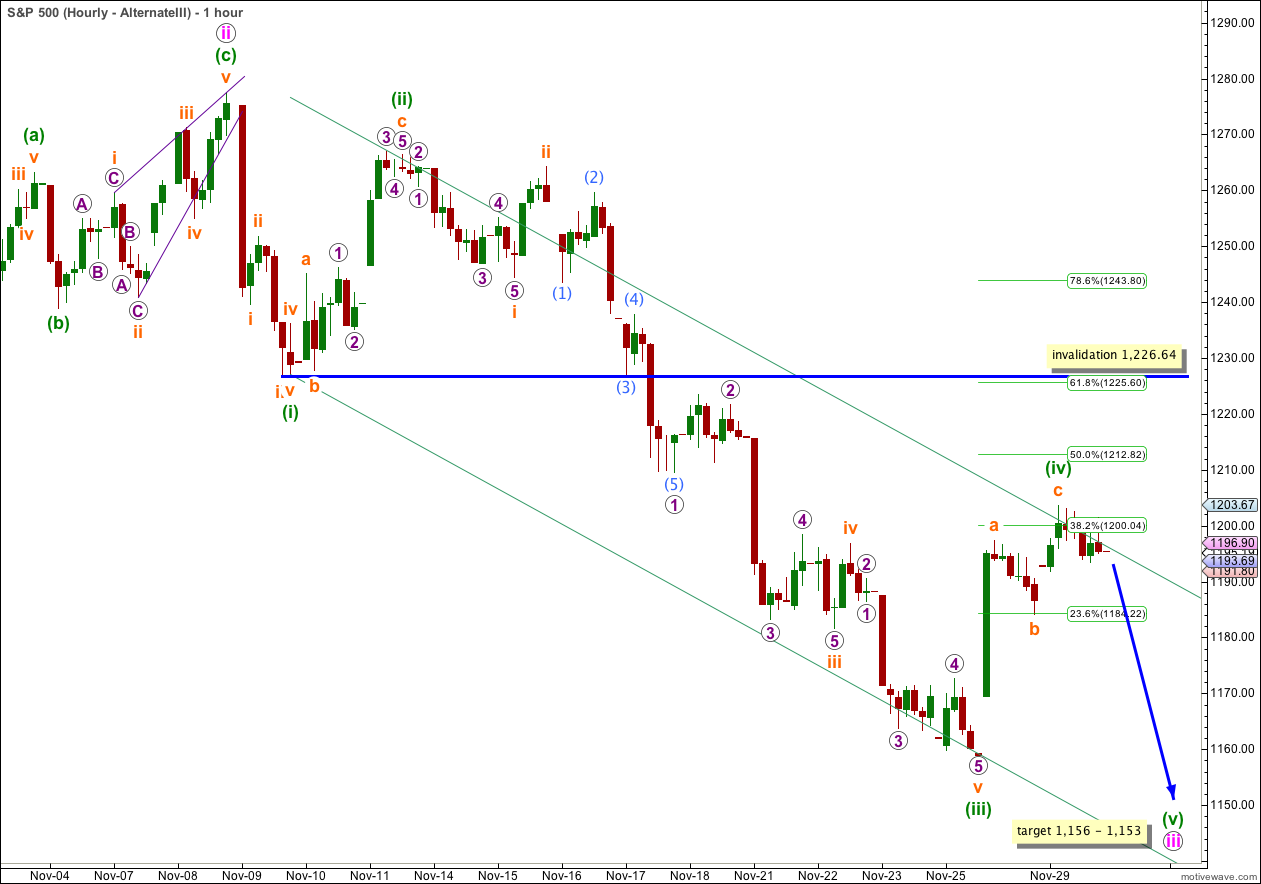
Another reason why this wave count has such a good look is the parallel channel containing this downwards movement. This channel is drawn first with a trend line from the lows of (i) to (iii) green, and a parallel copy is placed upon the high of (ii) green. This almost perfectly shows where upwards movement ended during Tuesday’s session, with a small overshoot.
This wave count expects downwards movement tomorrow to unfold in a five wave structure for wave (v) green. There is no Fibonacci ratio between waves (i) and (iii) green and it is likely we should see a Fibonacci ratio between wave (v) green and either of (i) or (iii) green. At 1,153 wave (v) green would reach equality with wave (i) green.
At 1,156 wave iii pink would reach 1.618 the length of wave i pink. This gives us a 3 point target zone for downwards movement which should end in one or two sessions.
We would expect downwards movement to find support at the lower end of the parallel channel. Often fifth waves end mid-way within parallel channels.
Wave (iv) green may not move into wave (i) green price territory. This wave count is invalidated with movement above 1,226.64.
Daily Alternate Wave Count.
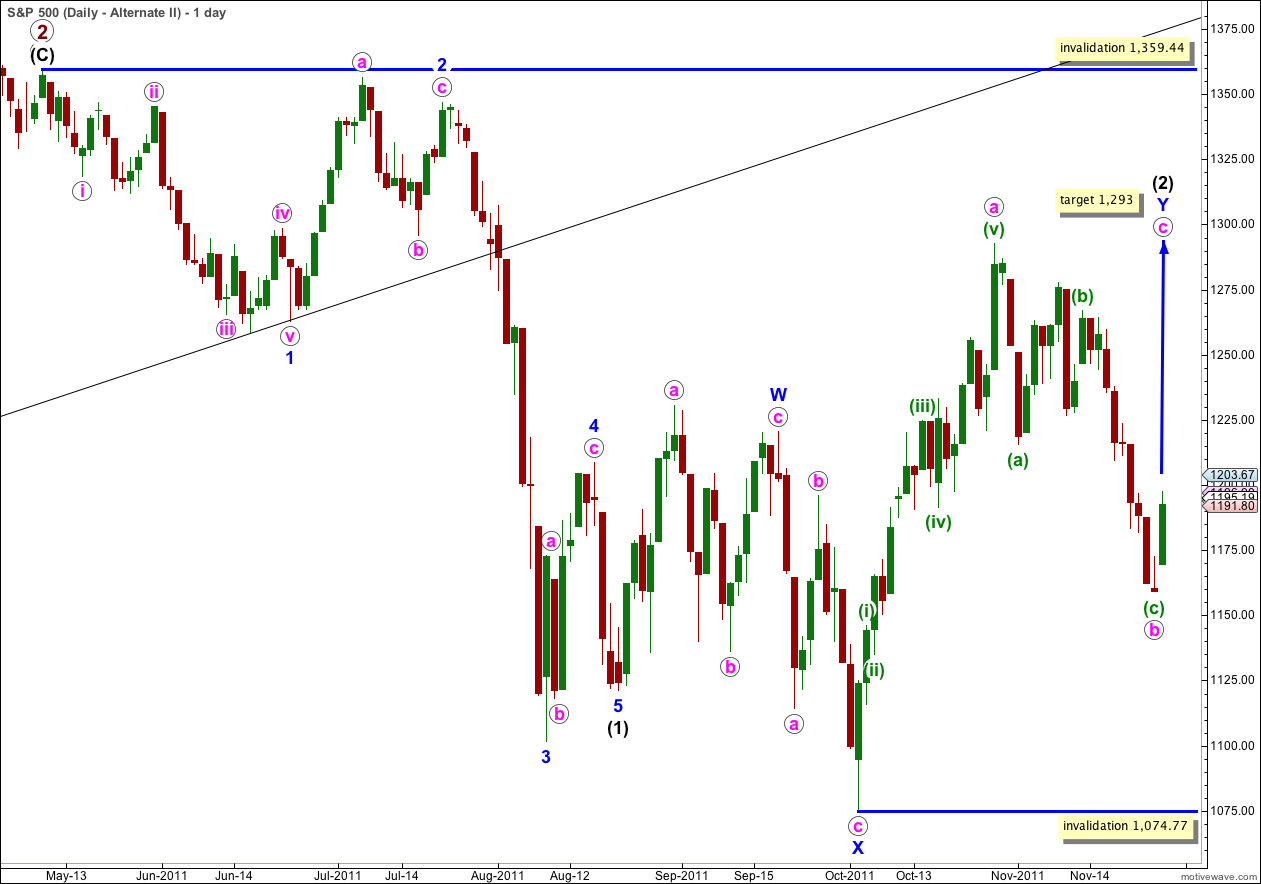
It remains technically possible that wave (2) black is incomplete and we may yet see price move above 1,292.66 in the mid term.
In the short term wave b pink within the zigzag of wave Y blue may have completed a three wave structure. Wave c pink upwards may have begun. At 1,293 wave c pink would reach 0.618 the length of wave a pink.
Wave (2) black may not move beyond the start of wave (1) black. This wave count is invalidated with movement above 1,359.44.
This wave count does not have as good a look as the main wave count as wave Y blue is significantly out of proportion to wave W blue. This wave count has a very low probability.