
Elliott Wave chart analysis for the S&P 500 for 28th November, 2011. Please click on the charts below to enlarge.
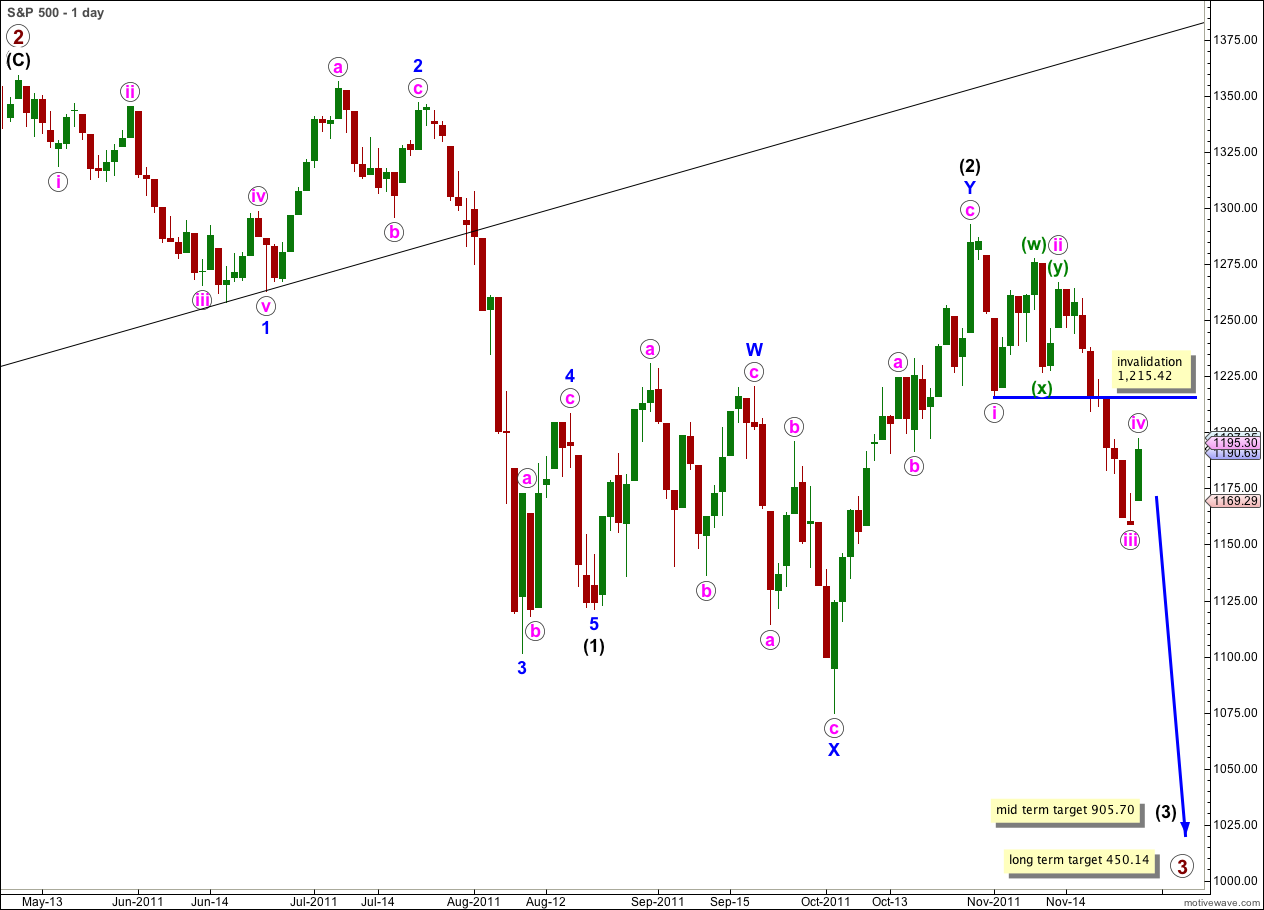
The new trading week began immediately with a larger correction. This is most likely wave iv pink within wave 1 blue.
Wave ii pink was a deep 67% double zigzag correction lasting 8 days. We may expect wave iv pink to be a shallow 0.382 correction which should also last about 5 to 8 days.
At this stage there are 13 possible corrective structures that wave iv pink may take and only one of these (a double zigzag) is highly unlikely. In contrast to a third wave which has only one possible structure (an impulse) a fourth wave offers more variation. We will have to work with alternate wave counts for the next week while this fourth wave unfolds.
Wave iv pink may not move into wave i pink price territory. This wave count is invalidated with movement above 1,215.42.
If this wave count is invalidated with movement above 1,215.42 our alternate would see wave iii pink instead as wave i green within iii pink, and upwards movement would be wave ii green within iii pink. Such a wave count does not have as good a look as the one we are using, its probability is much lower.
Main Hourly Wave Count.
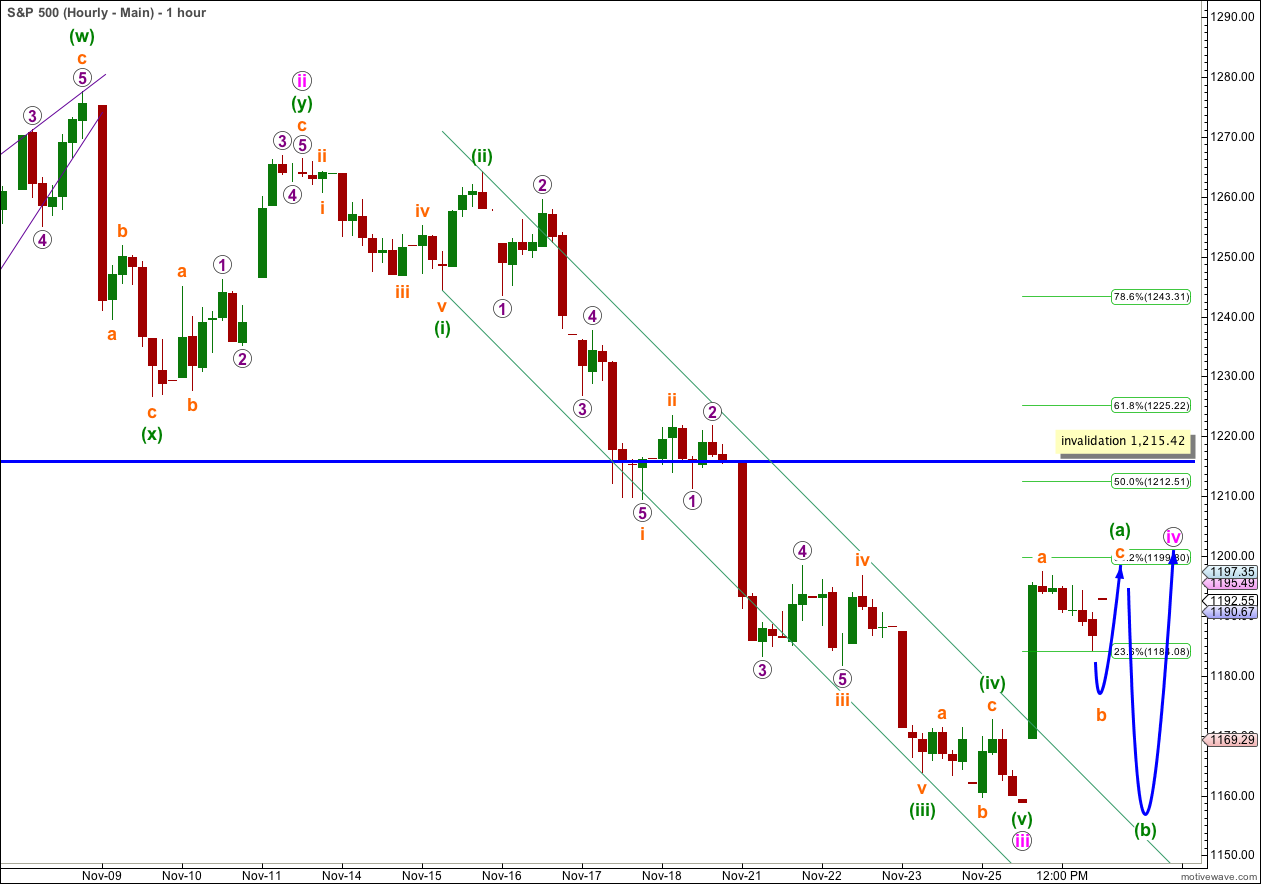
Wave iv pink must be a shallow correction for this wave count to remain valid.
At this stage upwards movement to begin Monday’s session was initially in a clear impulsive movement. Wave (a) green within wave iv pink may be unfolding as a three wave zigzag. This would indicate a flat or triangle for wave iv pink could be more likely.
At this very early stage a target for wave iv pink is at the 0.382 Fibonacci ratio of wave iii pink at 1,199.80.
Alternate Hourly Wave Count.
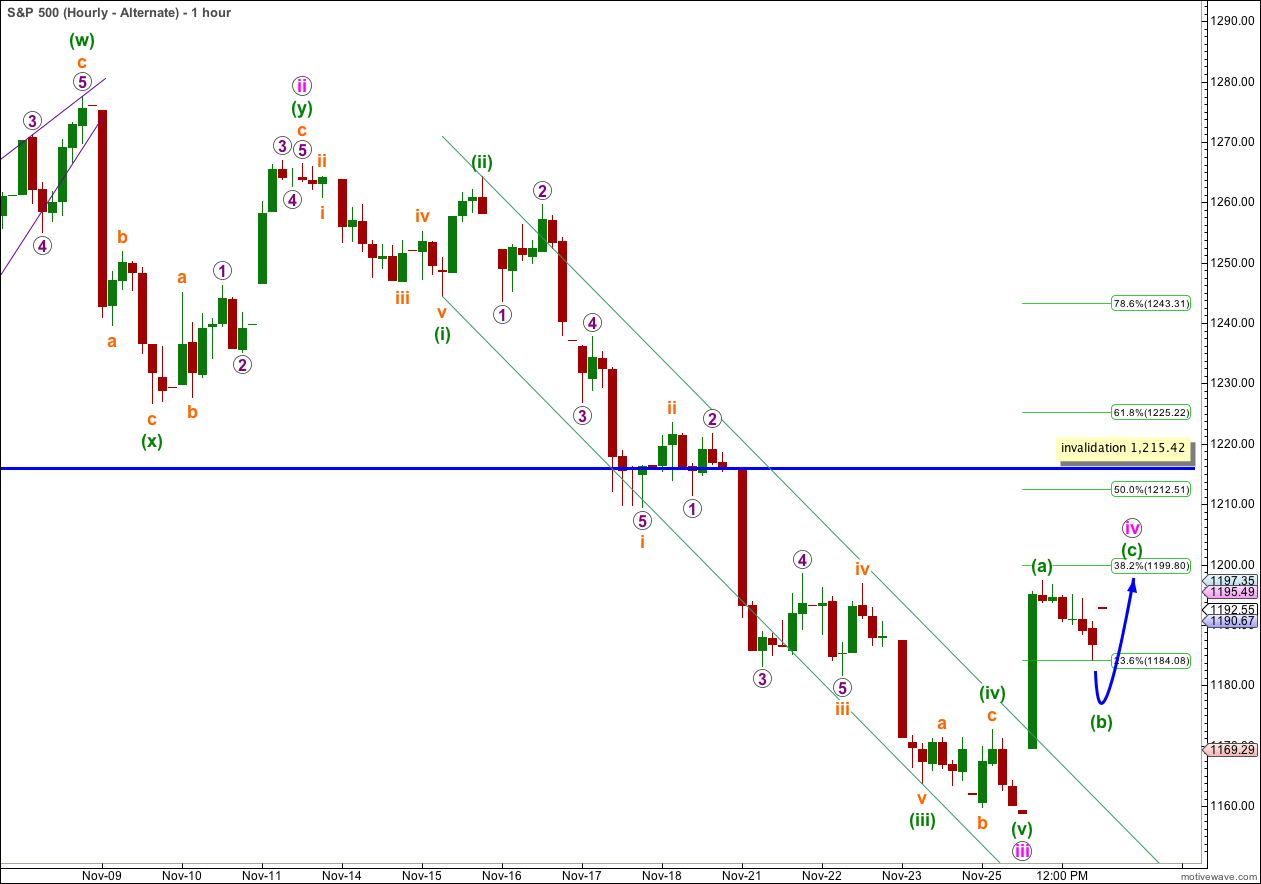
This alternate wave count is essentially the same as the main hourly wave count, except the degree of labeling within wave iv pink has been moved up one degree. It is unlikely that wave iv pink would be over so soon, but it is a technical possibility that we must consider.
Alternate Daily Wave Count.
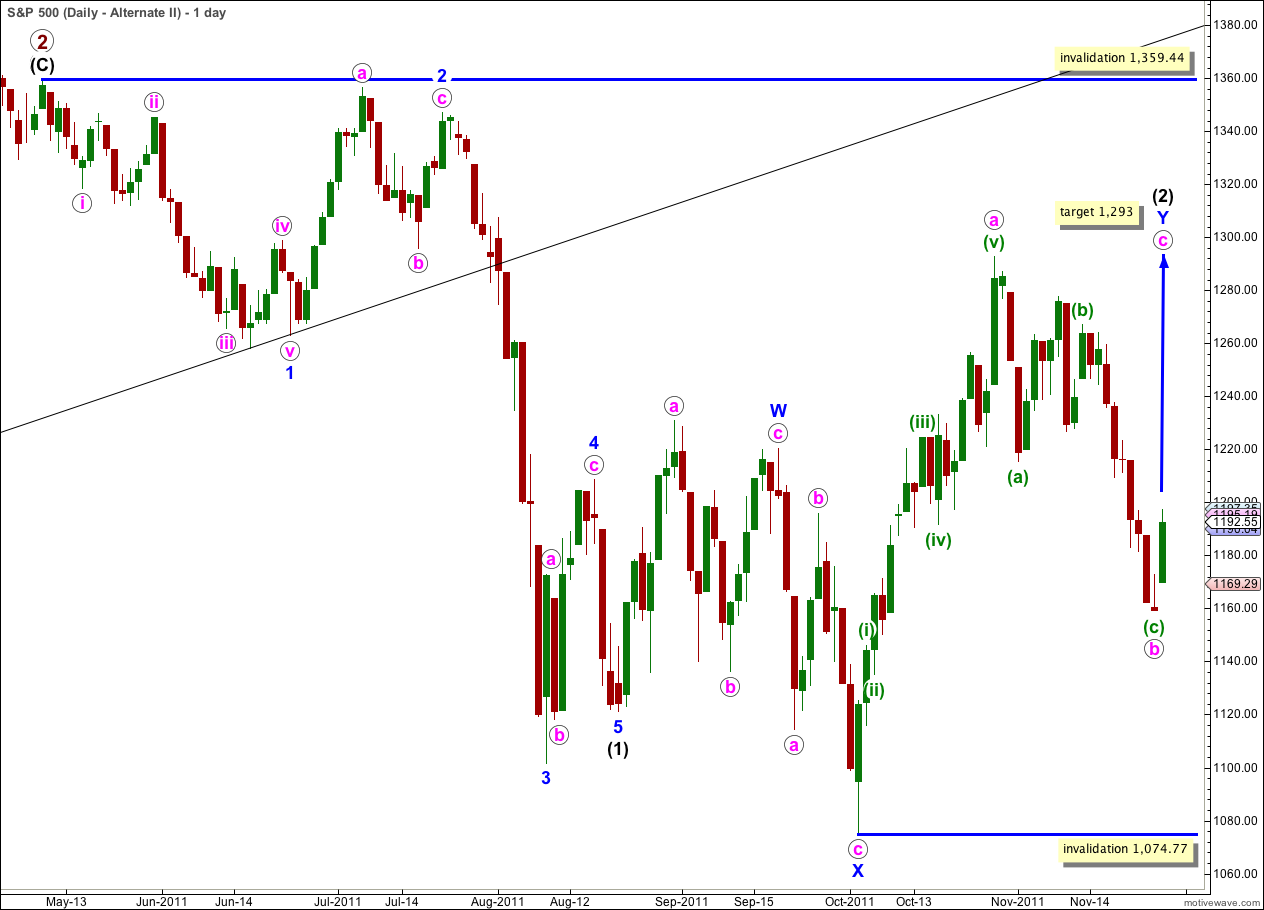
It remains technically possible that wave (2) black is incomplete and we may yet see price move above 1,292.66 in the mid term.
In the short term wave b pink within the zigzag of wave Y blue may have completed a three wave structure. Wave c pink upwards may have begun. At 1,293 wave c pink would reach 0.618 the length of wave a pink.
Wave (2) black may not move beyond the start of wave (1) black. This wave count is invalidated with movement above 1,359.44.
This wave count does not have as good a look as the main wave count as wave Y blue is significantly out of proportion to wave W blue. However, this only reduces the probability of this wave count and it does not invalidate it.
The subdivisions on the hourly chart are exactly the same as for the main wave count. 1-2-3 and a-b-c have the same subdivisions. The targets and invalidation points for the short term are the same.