
Elliott Wave chart analysis for the S&P 500 for 25t November, 2011. Please click on the charts below to enlarge.
Friday’s half session completed a small correction and then turned lower as expected.
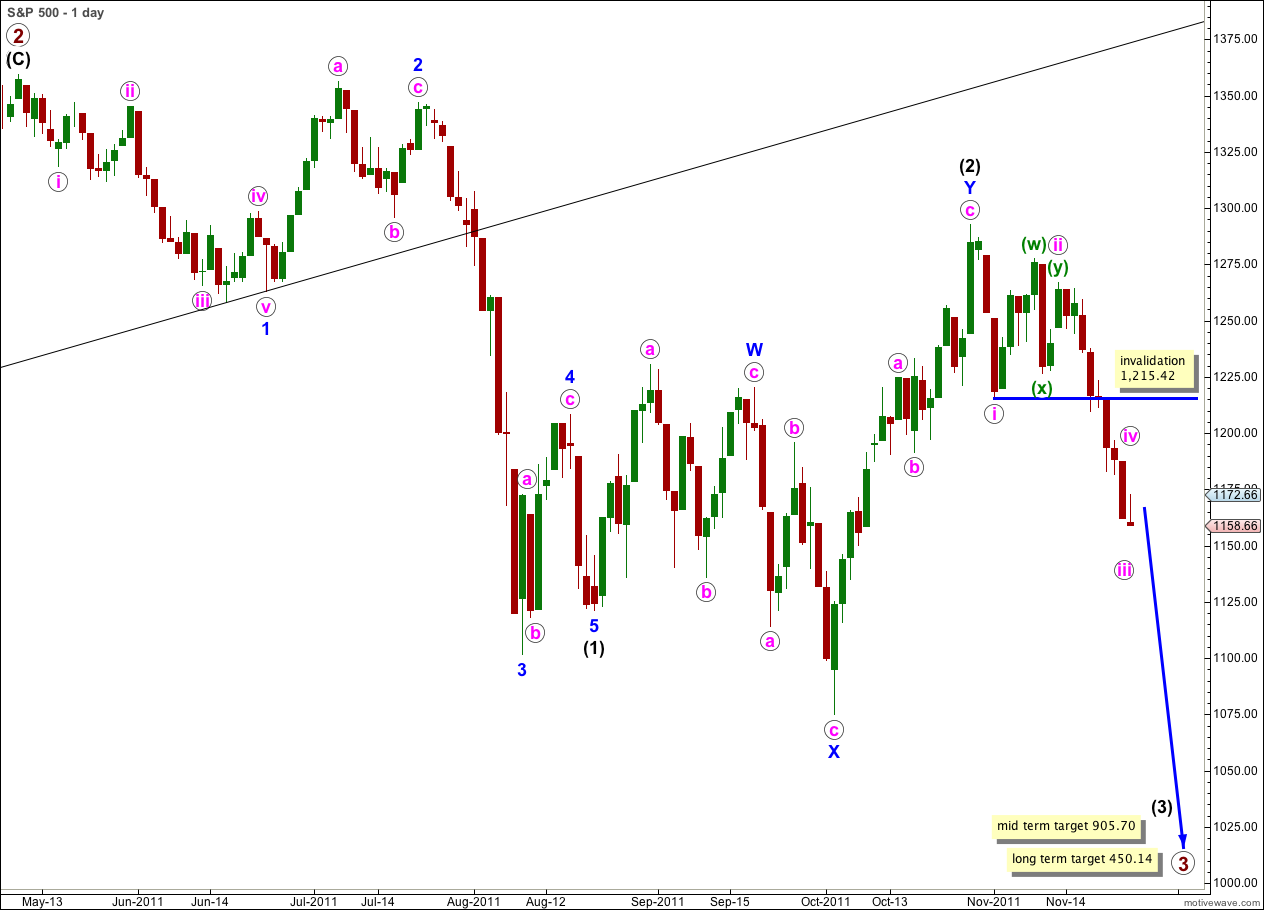
There is probably a little more downwards movement yet before wave iii pink is complete. The target is slightly recalculated.
Wave iii pink may end after one more session.
When wave iii pink is complete we shall expect a more time consuming correction for wave iv pink. This correction is likely to last about 5 to 8 days. Wave iv pink is most likely to be a flat or a triangle. It is unlikely to be a complicated double correction.
When wave iii pink is complete we shall draw a Fibonacci retracement along its length. Wave iv pink is most likely to reach either 0.236 or 0.382 the length of wave iii pink.
Wave iv pink may not move into wave i pink price territory. This wave count is invalidated with movement above 1,215.42.
The mid term target for wave (3) black is still some weeks away. At 905.70 wave (3) black would reach 1.618 the length of wave (1) black.
The long term target for primary wave 3 is still months away. At 450.14 primary wave 3 would reach equality in length with primary wave 1.
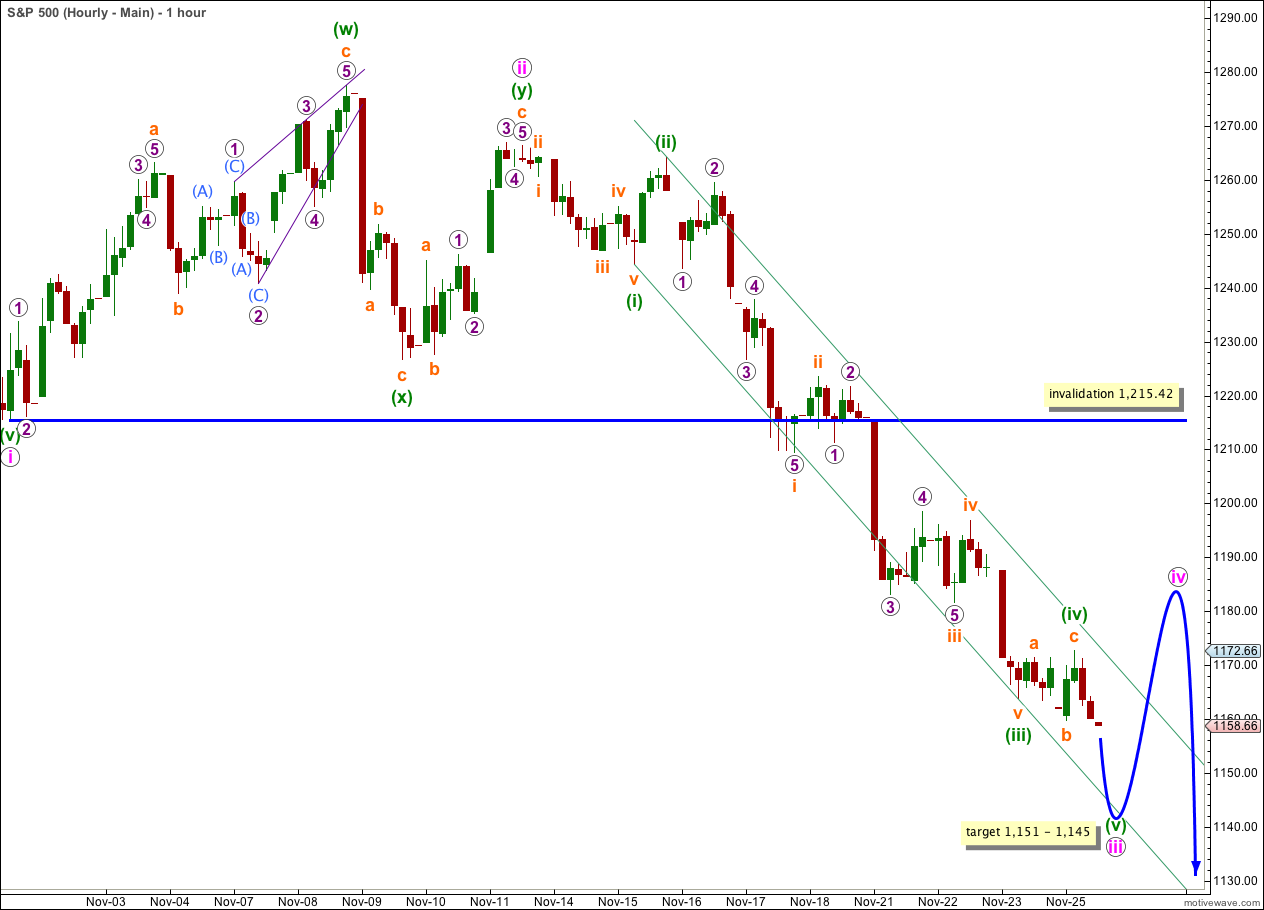
Wave (iv) green continued sideways and slightly higher, ending before price reached the upper edge of the parallel channel containing wave iii pink downwards.
There is now nice alternation between waves (ii) and (iv) green. Wave (ii) green is a zigzag and wave (iv) green is a flat correction.
With wave (iv) green ending slightly higher the upper edge of the target zone is recalculated. At 1,151 wave (v) green would reach equality with wave (i) green. However, there is already a reasonably close Fibonacci ratio between waves (i) and (iii) green so we may not see a Fibonacci ratio between wave (v) green and either of (i) or (iii). For this reason we should favour the lower end of the target zone.
At 1,145 wave iii pink would reach 1.618 the length of wave i pink.
So far on the 5 minute chart the structure for wave (v) green looks like a complete five wave impulse. It is possible that is over already, or this may only be wave 1 within wave (v) green. Movement to a new high above the high labeled (iv) green at 1,172.66 would indicate that wave (v) green and so wave iii pink is complete. At that point we should expect that wave iv pink is underway.
The upcoming fourth wave correction should be a choppy overlapping time consuming movement.
Alternate Daily Wave Count.
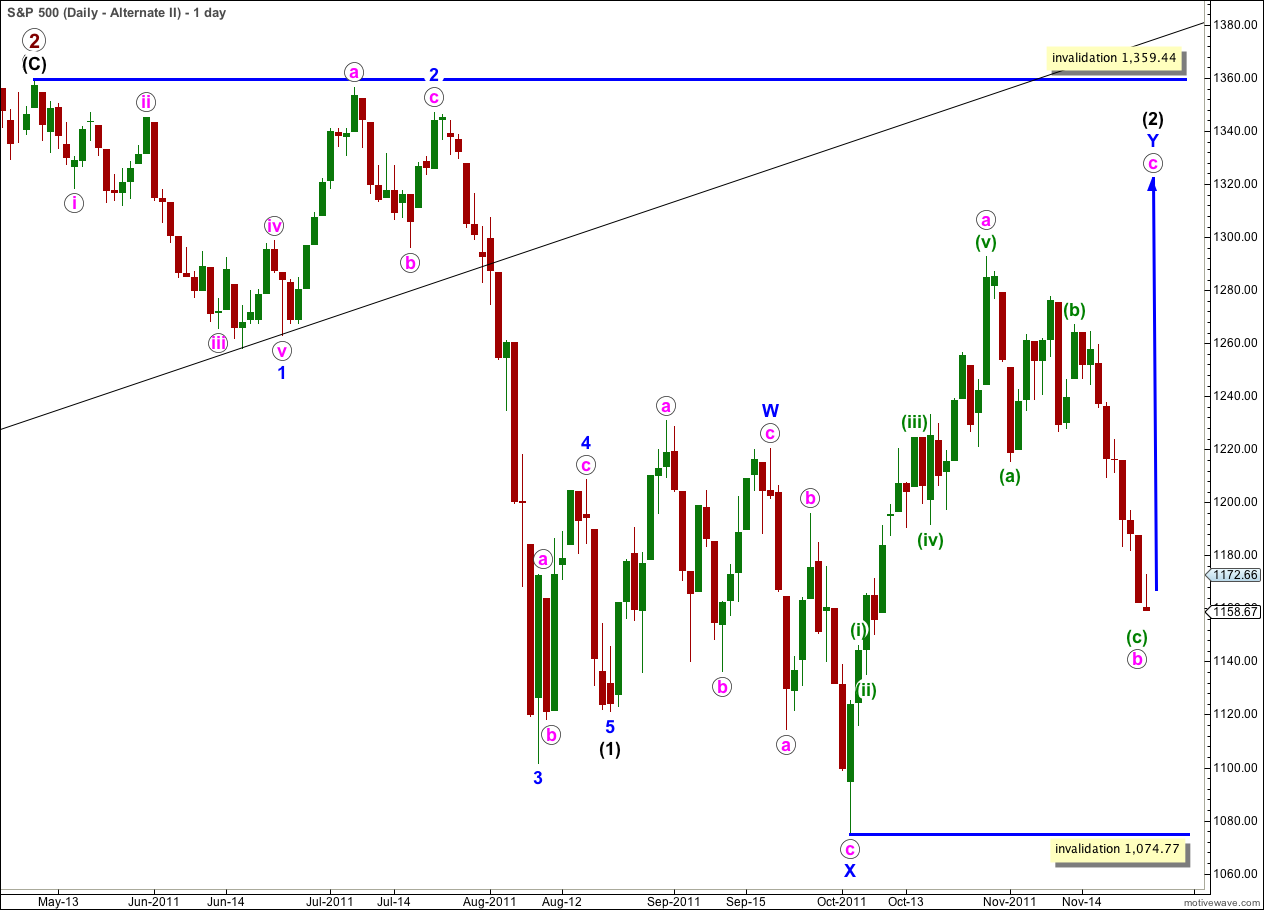
It remains technically possible that wave (2) black is incomplete and we may yet see price move above 1,292.66 in the mid term.
In the short term wave b pink within the zigzag of wave Y blue may have completed a three wave structure. Wave c pink upwards may begin.
Wave (2) black may not move beyond the start of wave (1) black. This wave count is invalidated with movement above 1,359.44.
This wave count does not have as good a look as the main wave count as wave Y blue is significantly out of proportion to wave W blue. However, this only reduces the probability of this wave count and it does not invalidate it.
The subdivisions on the hourly chart are exactly the same as for the main wave count. 1-2-3 and a-b-c have the same subdivisions. The targets and invalidation points for the short term are the same.