
Elliott Wave chart analysis for the S&P 500 for 23rd November, 2011. Please click on the charts below to enlarge.
The correction we were expecting did not eventuate as it was over before the session began. Price continued lower towards targets on the alternate hourly chart. This downwards movement is impulsive and is not part of a fourth wave correction.
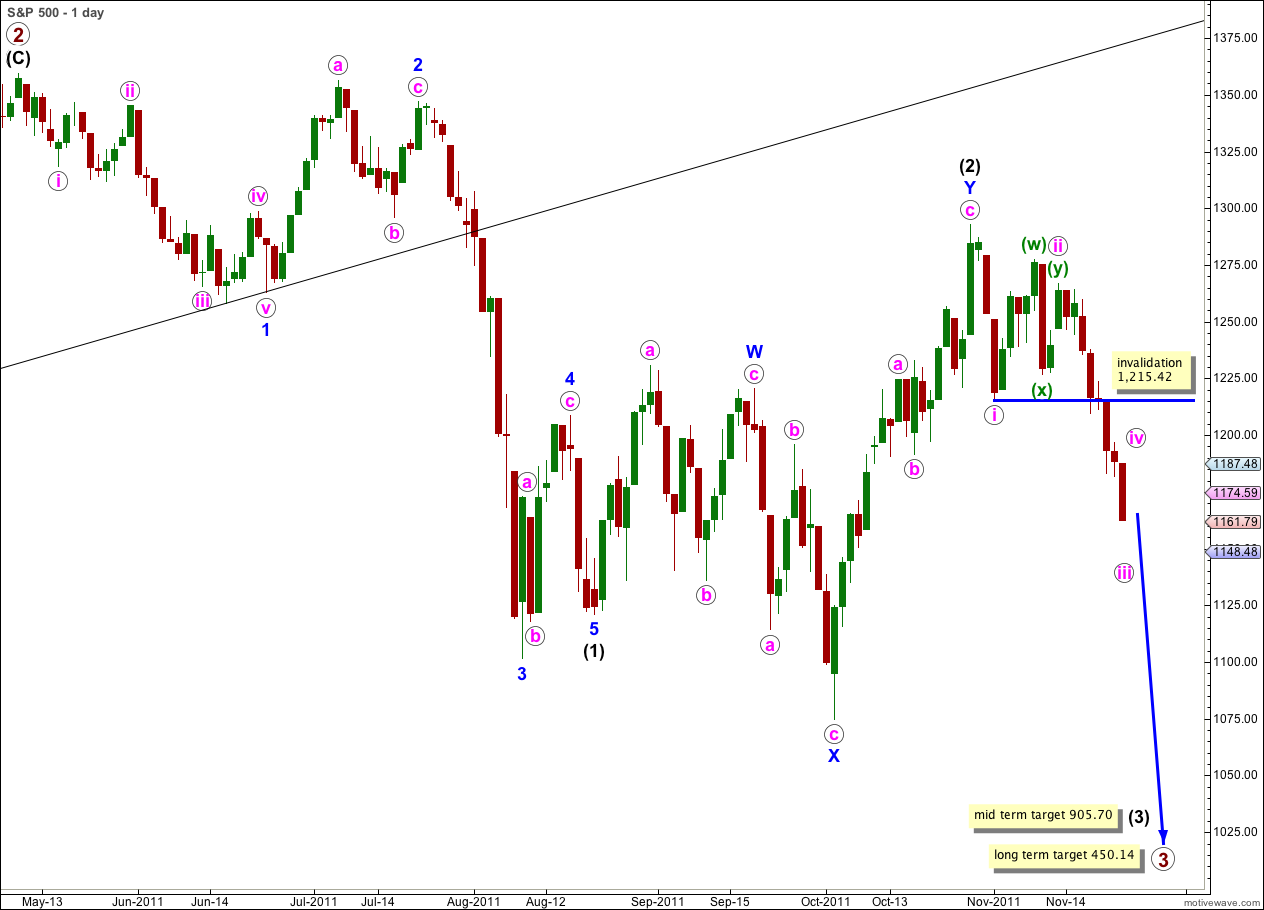
Wave iii pink is close to completion but the structure is incomplete. We should see further downwards movement before it is over.
When wave iii pink is complete wave iv pink may not move into wave i pink price territory. This wave count is invalidated with movement above 1,215.42.
The mid term target for wave (3) black is still some weeks away. At 905.70 wave (3) black would reach 1.618 the length of wave (1) black.
The long term target for primary wave 3 is still months away. At 450.14 primary wave 3 would reach equality in length with primary wave 1.
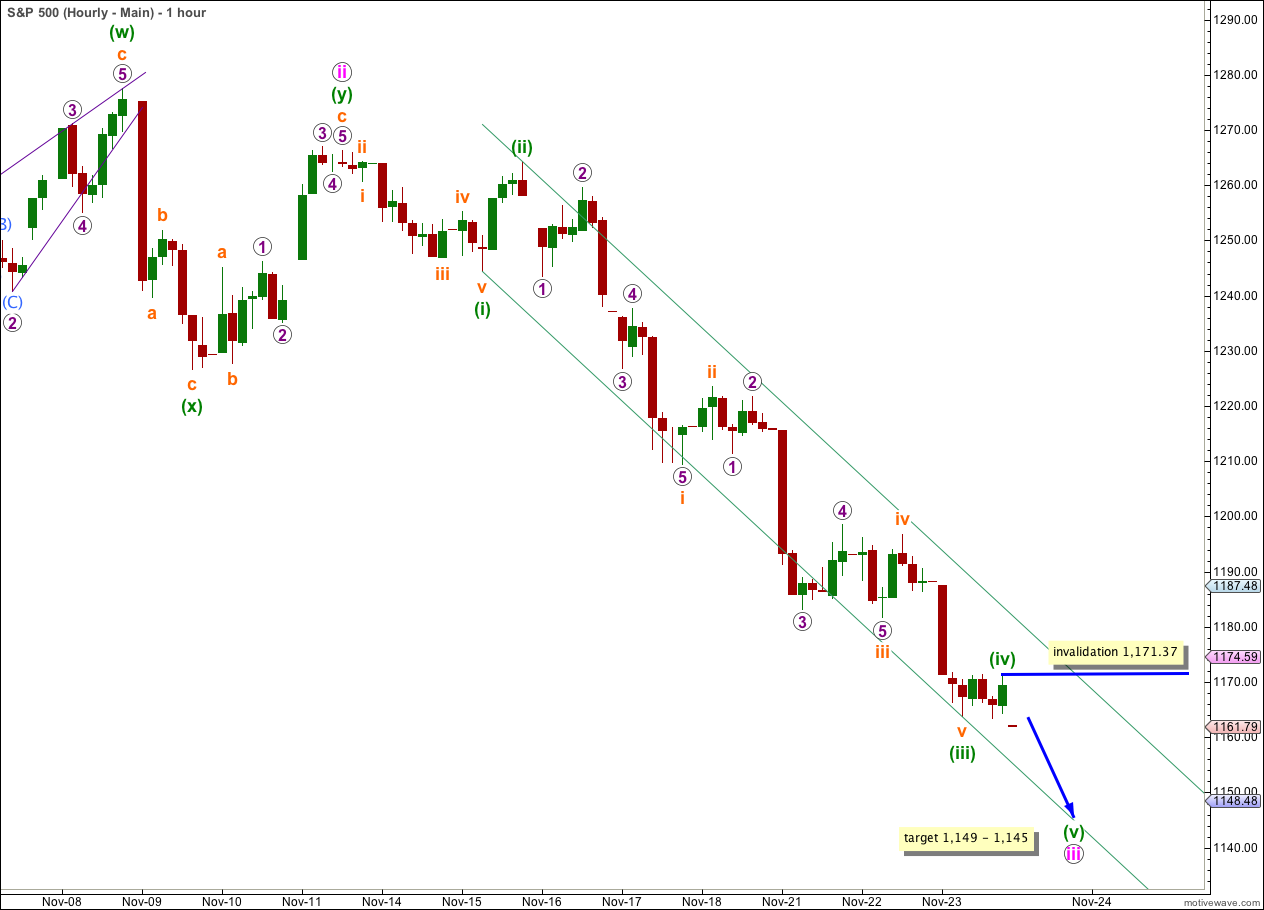
There are several ways to count this downwards movement but I will present only one hourly chart for you today. The most commonly extended wave within an impulse is the third wave, and this wave count agrees with MACD. It has the best fit and look.
No matter how we label the subdivisions of recent downwards movement the count is 8 thus far. Wave iii pink must have an impulsive count of 9, or 13 (see last paragraph page 54, “Elliott Wave Principle” by Frost and Prechter). This structure requires further downwards movement to complete it.
Ratios within wave (i) green are: wave iii orange has no Fibonacci ratio to wave i orange, and wave v orange is just 0.05 points short of 0.618 the length of wave iii orange.
Ratios within wave (iii) green are: wave iii orange has no Fibonacci ratio to wave i orange, and wave v orange is 0.86 points short of 0.618 the length of wave i orange.
Ratios within wave i orange of wave (iii) green are: wave 3 purple is 0.69 points short of 1.618 the length of wave 1 purple, and wave 5 purple has no Fibonacci ratio to either of 1 or 3 purple.
Within wave iii orange of wave (iii) green there are no adequate Fibonacci ratios between purple waves 1, 3 and 5.
Wave (iii) green is 7.18 points longer than 4.236 the length of wave (i) green (a 7% variation, less than 10% is acceptable). We may not see a Fibonacci ratio between wave (v) green and either of (i) or (iii). Wave (v) green would reach equality in length with wave (i) green at 1,149.
Wave iii pink would reach 1.618 the length of wave i pink at 1,145. We should favour the lower end of this target zone.
Within wave (v) green wave ii orange may not move beyond the start of wave i orange. Movement above 1,171.37 would invalidate this wave count as it is labeled. If we see movement above 1,171.37 tomorrow then my labeling of (iv) green is premature and it is probably continuing sideways as a double flat or double combination. If this happens then use the upper edge of the parallel channel as a guide to where wave (iv) green is most likely to end.
The parallel channel continues to be very useful. Here it is drawn from the lows labeled (i) and (iii) green, and a parallel copy is placed upon the high labeled (ii) green. When we see significant movement above this channel then we may be confident that wave iii pink is over and wave iv pink is underway.
Wave iii pink may end in one or two more sessions.
Alternate Daily Wave Count.
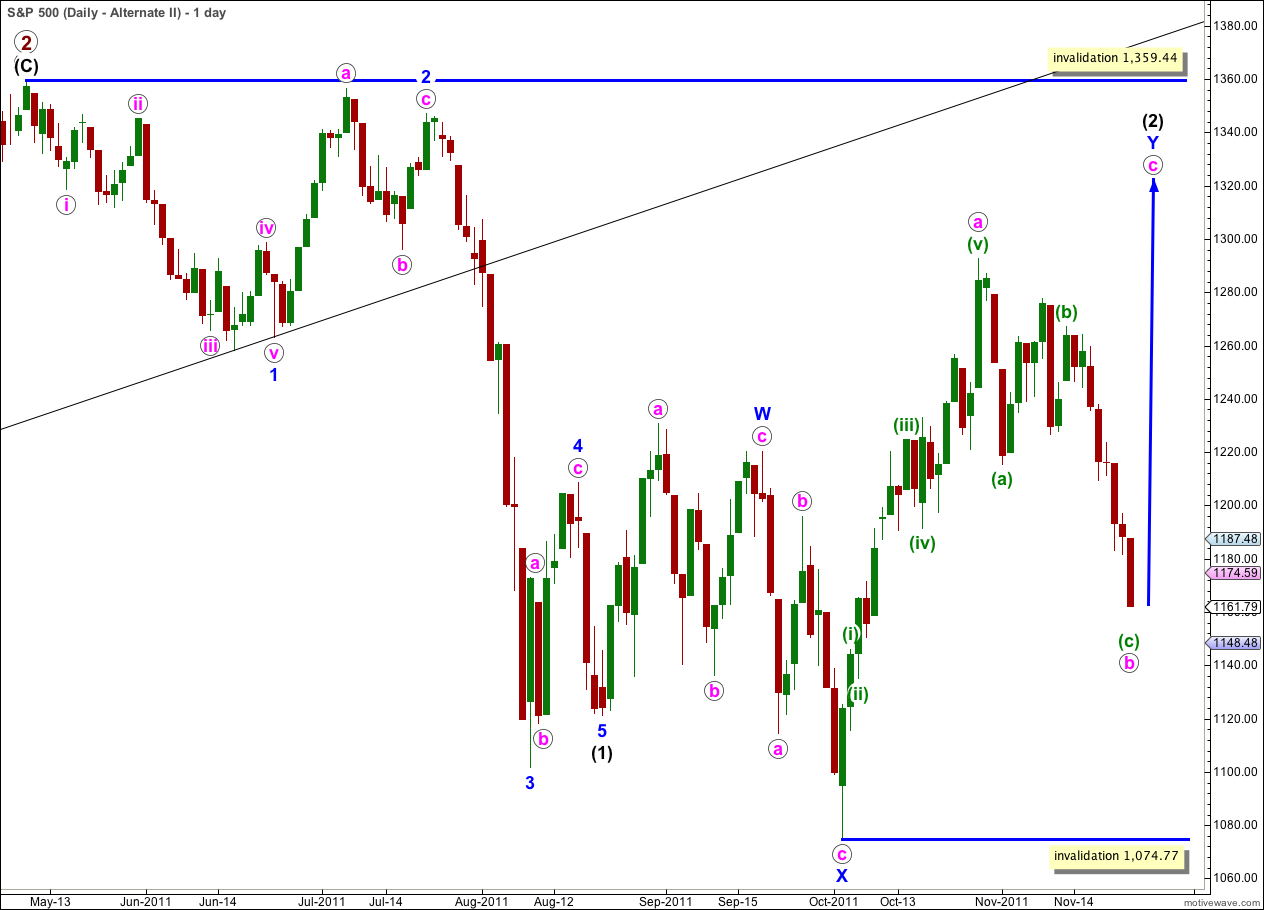
It remains technically possible that wave (2) black is incomplete and we may yet see price move above 1,292.66 in the mid term.
In the short term wave b pink within the zigzag of wave Y blue may have completed a three wave structure. Wave c pink upwards may begin.
Wave (2) black may not move beyond the start of wave (1) black. This wave count is invalidated with movement above 1,359.44.
This wave count does not have as good a look as the main wave count as wave Y blue is significantly out of proportion to wave W blue. However, this only reduces the probability of this wave count and it does not invalidate it.
The subdivisions on the hourly chart are exactly the same as for the main wave count. 1-2-3 and a-b-c have the same subdivisions. The targets and invalidation points for the short term are the same.