
Elliott Wave chart analysis for the S&P 500 for 22nd November, 2011. Please click on the charts below to enlarge.
Last analysis main wave count expected further downwards movement. Tuesday’session saw a slightly lower low, but price fell well short of the target zone calculated. Price moved sideways.
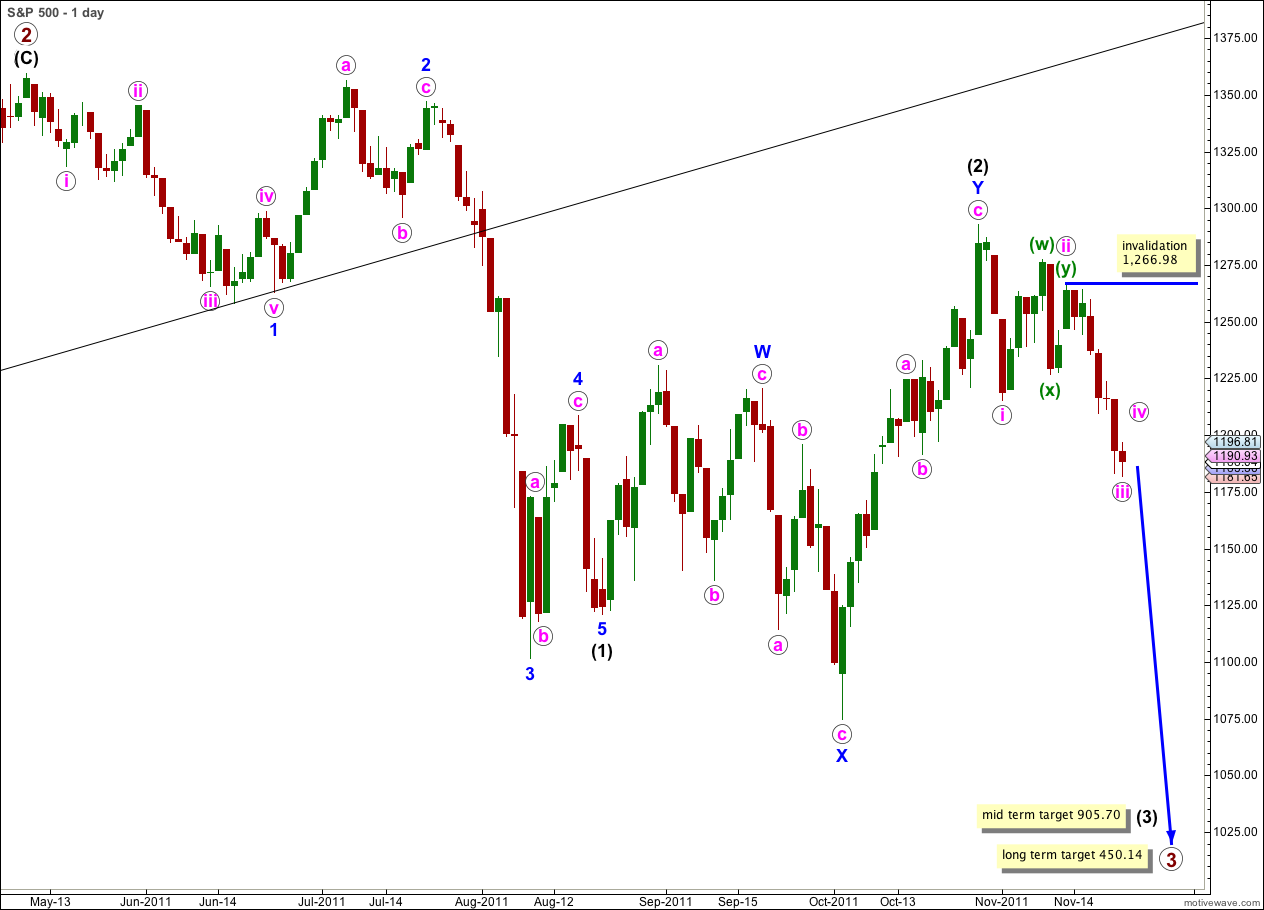
Within wave 1 blue of (3) black waves i and now iii pink are likely to be complete.
Wave ii pink was a deep 68% correction of wave i pink and we may expect wave iv pink to most likely be a shallow correction of wave iii pink.
Wave ii pink was a double combination correction and we may expect wave iv pink to be a shallow flat or triangle.
We still have two hourly wave counts today which look at this recent downwards movement differently. The main wave count sees a correction at pink degree for iv pink beginning here, and the alternate sees a smaller and briefer correction for wave (ii) green within wave iii pink beginning here.
We are expecting some corrective movement from this point as most likely, it is the duration and depth of the correction of which we cannot be sure.
Main Hourly Wave Count.
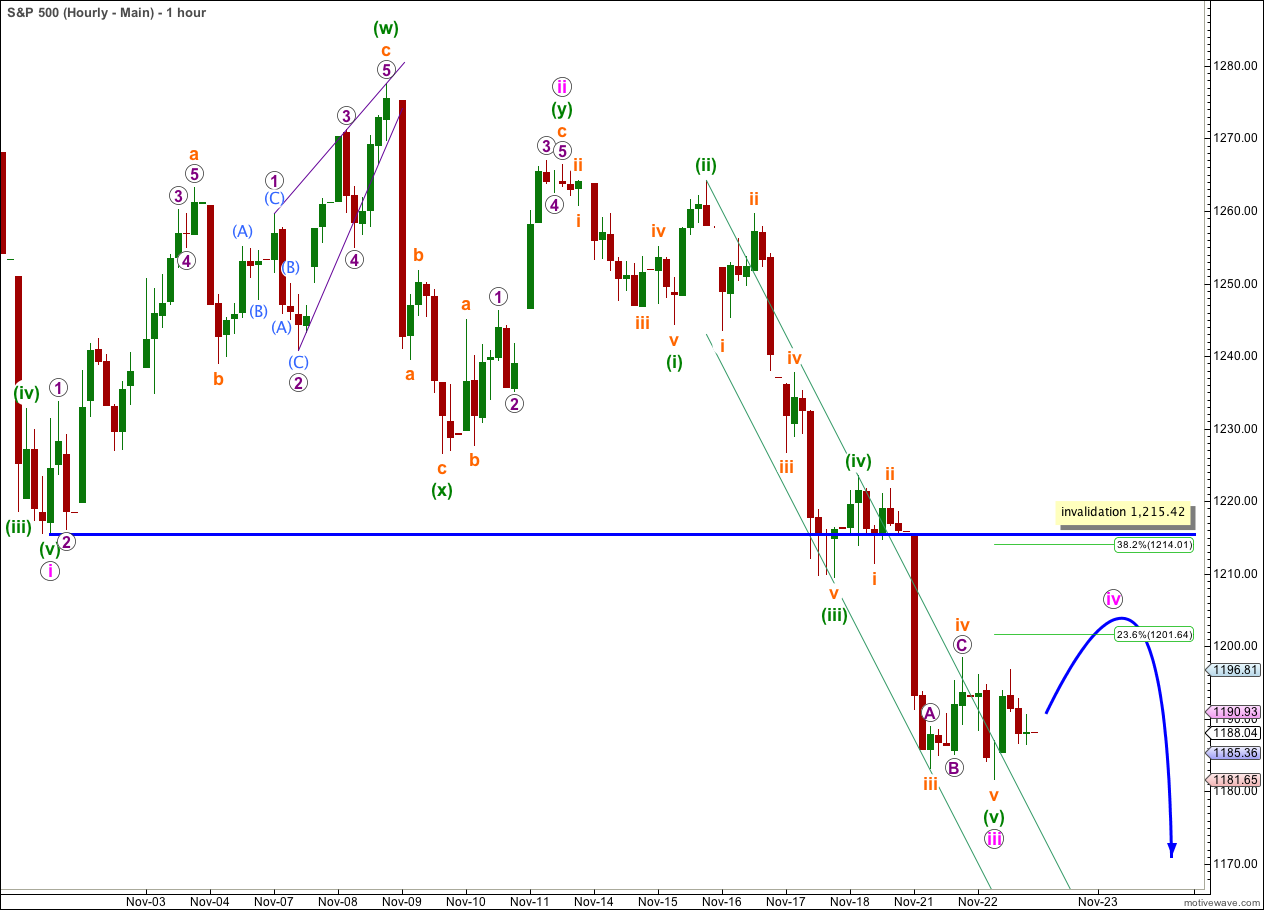
This wave count sees wave iv pink as just begun. Wave iii pink lasted 7 days, one day short of a Fibonacci 8.
Wave iv pink is most likely to be a flat or triangle. It can only be shallow as a deep correction here would invalidate the wave count.
There is no Fibonacci ratio between waves i and iii pink.
Ratios within wave iii pink are: wave (iii) green is 2.83 points short of 2.618 the length of wave (i) green, and there is no Fibonacci ratio between wave (v) green and either of (i) or (iii).
Within wave (v) green there are no adequate Fibonacci ratios between orange waves i, iii or v.
If wave iv pink is a running triangle or an expanded flat correction it may have a B wave within it which makes a new low. There can be no lower invalidation point for this wave count for this reason.
Wave iv pink may not move into wave i pink price territory. This wave count is invalidated with movement above 1,215.42.
For this main hourly wave count the subdivision of wave v orange of wave (v) green must be seen as a five wave structure. This is the best fit on the five minute chart and this wave count has a higher probability than the alternate below for this reason.
We should expect wave iv pink to last about a week to 8 days.
Alternate Hourly Wave Count.
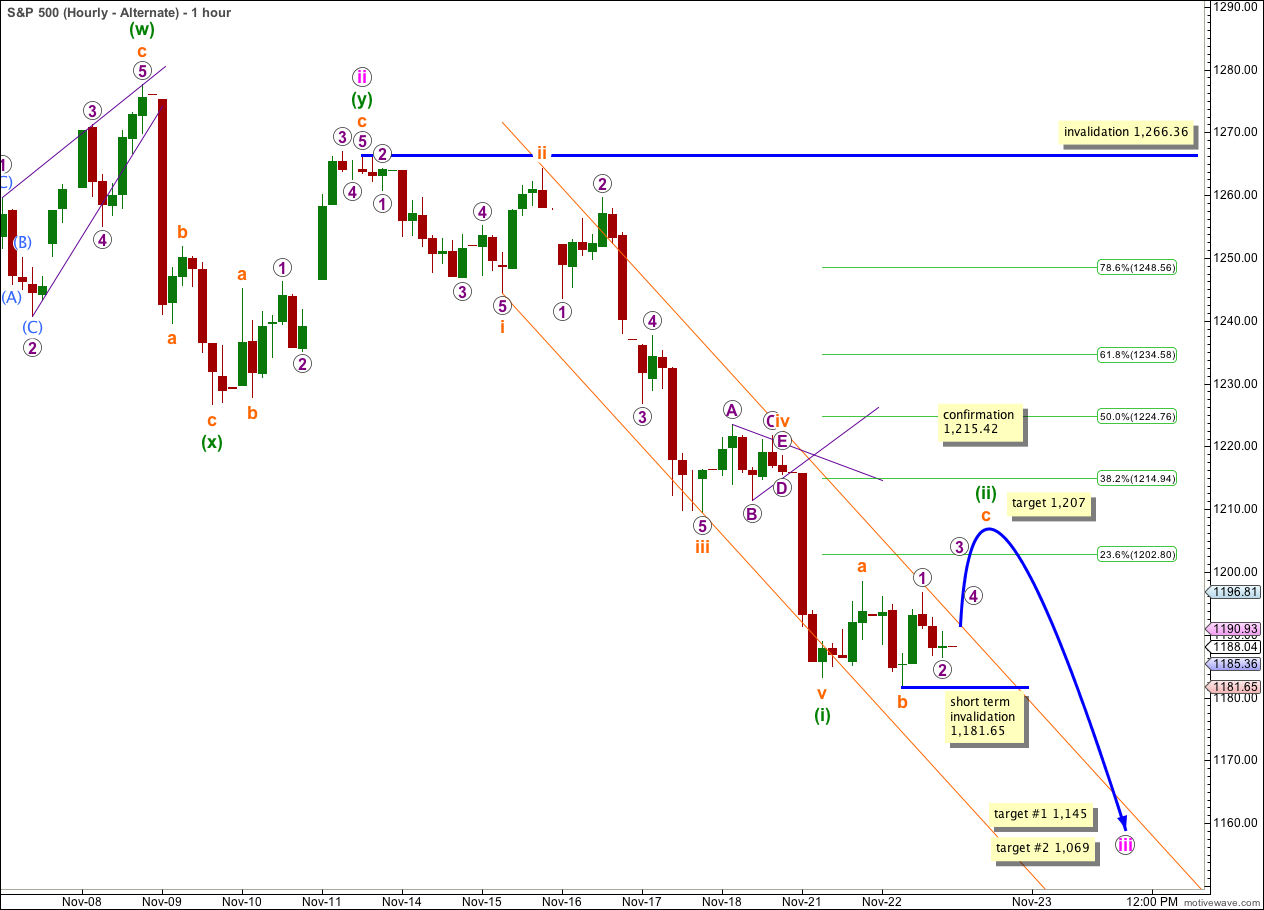
If a five wave impulse ended at the low labeled (i) green then we may expect a more brief correction, which should be over within the next one to two sessions.
This alternate wave count must see the downwards movement labeled wave b orange within wave (ii) green as a three wave structure. This movement is ambiguous: it is possible to see it as a three on the 5 minute chart but this does not have quite as good a fit as seeing it as a five. This reduces the probability of this wave count.
Wave (ii) green would be unfolding as an expanded flat correction (or a double with the first structure an expanded flat) because wave b orange is a 110% correction of wave a orange. At 1,207 wave c orange would reach 1.618 the length of wave a orange and wave (ii) green would end with an overshoot of the 0.236 Fibonacci ratio.
Within wave c orange wave 2 purple may not move beyond the start of wave 1 purple. In the short term movement below 1,181.65, before wave c orange is a complete five wave structure, would invalidate this wave count.
When wave c orange is complete we may expect further strong downwards movement as wave (iii) green within wave iii pink begins.
Wave (ii) green may not move beyond the start of wave (i) green. This wave count is invalidated with movement above 1,266.36.
If price were to move above 1,215.42 then our main hourly wave count would be invalidated and this alternate would be confirmed. But this correction may be shallow and price may not get that high. If that is the case then the duration of the correction and the look of the structure on the daily chart will guide us as to which wave count is most likely.
Alternate Daily Wave Count.
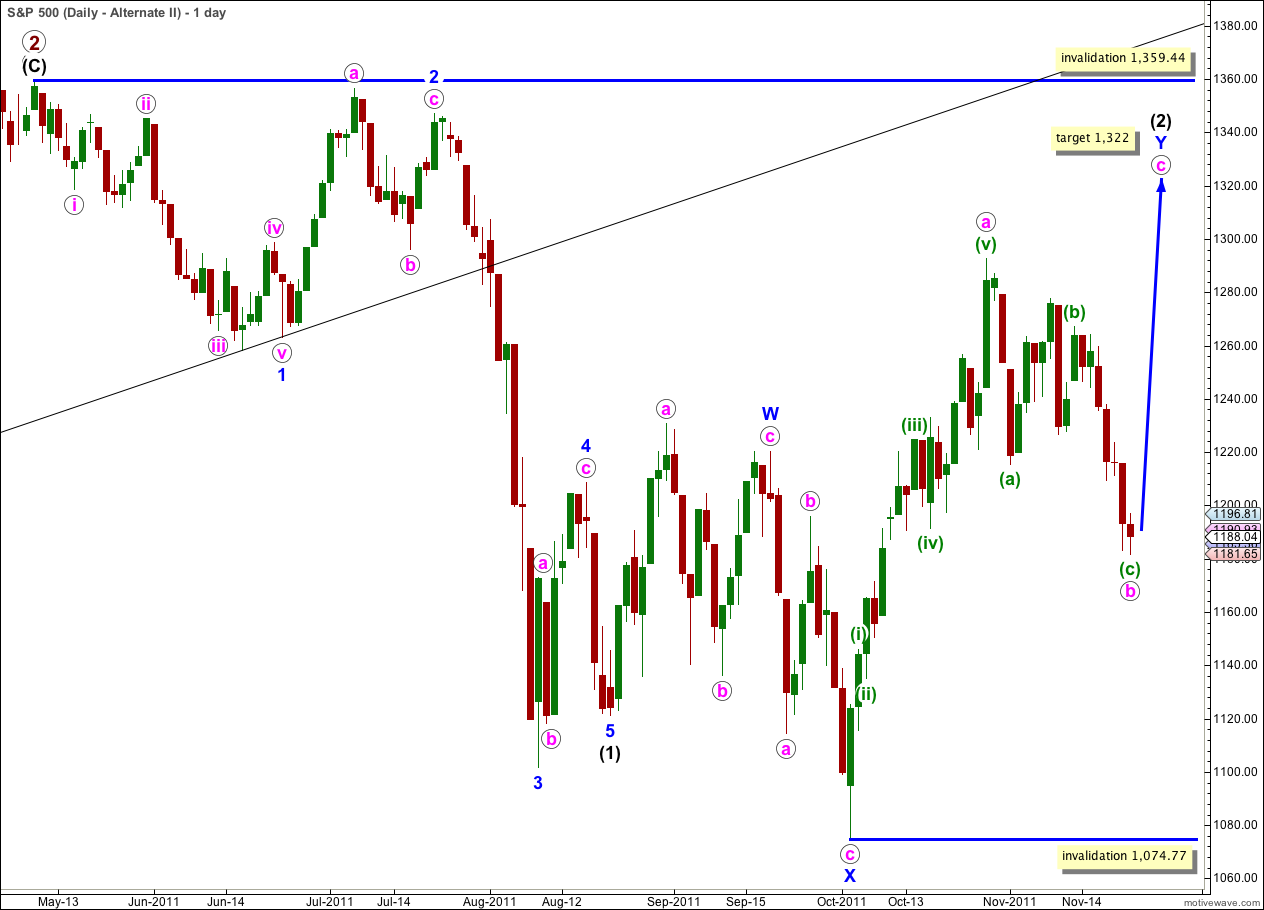
It remains technically possible that wave (2) black is incomplete and we may yet see price move above 1,292.66 in the mid term.
In the short term wave b pink within the zigzag of wave Y blue may have completed a three wave structure. Wave c pink upwards may begin.
Wave (2) black may not move beyond the start of wave (1) black. This wave count is invalidated with movement above 1,359.44.
This wave count does not have as good a look as the main wave count as wave Y blue is significantly out of proportion to wave W blue. However, this only reduces the probability of this wave count and it does not invalidate it.
The subdivisions on the hourly chart are exactly the same as for the main wave count. 1-2-3 and a-b-c have the same subdivisions. The targets and invalidation points for the short term are the same.