
Elliott Wave chart analysis for the S&P 500 for 21st November, 2011. Please click on the charts below to enlarge.
Last analysis expected further downwards movement and this is what we have seen to begin the new trading week.
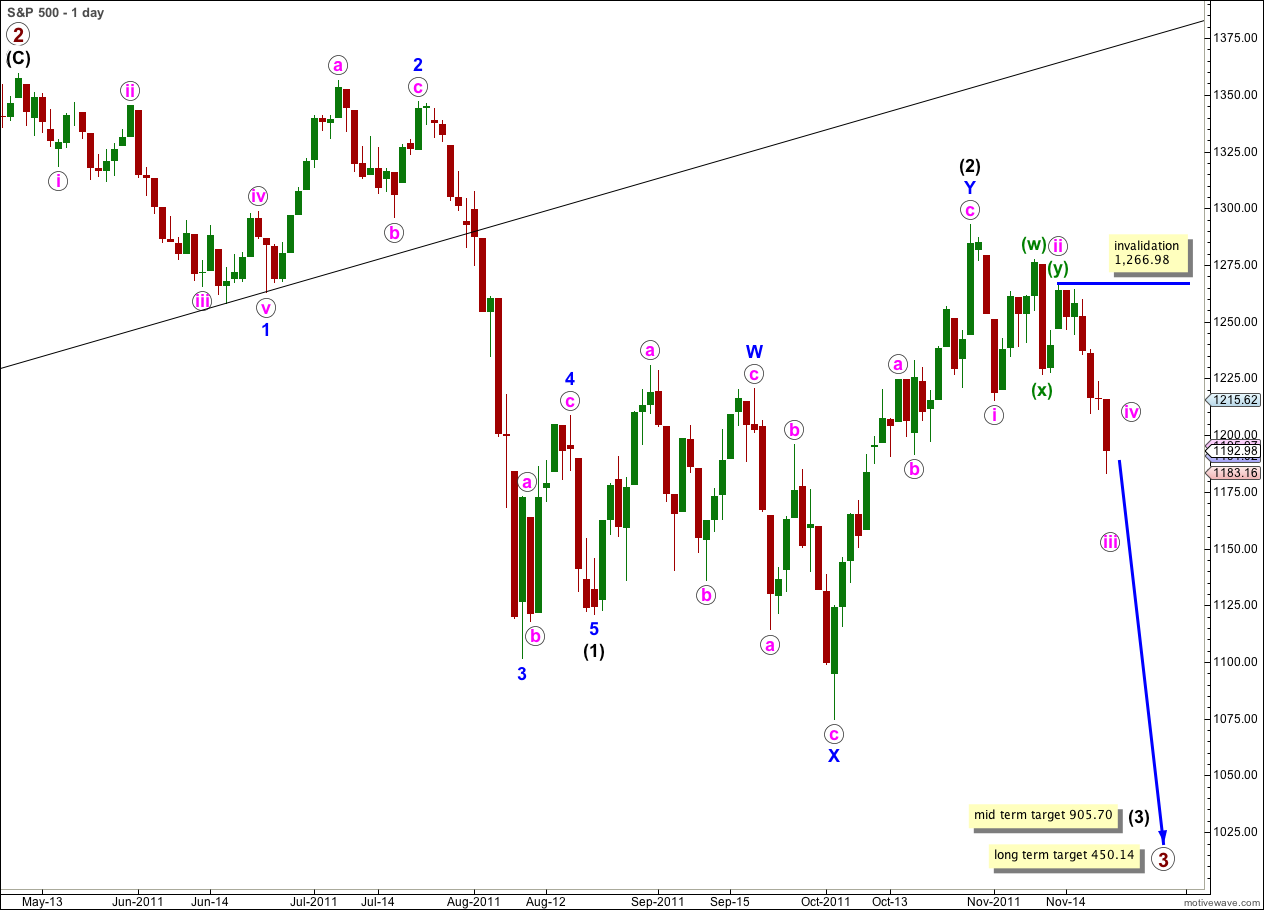
Within wave (3) black wave 1 blue is incomplete.
Within wave 1 blue wave iii pink is probably incomplete and it is 7.93 points longer than pink wave i. When pink wave iii is complete then we shall expect a fourth wave correction which may not move back into pink wave i price territory above 1,215.42.
Targets remain the same. At 905.70 wave (3) black will reach 1.618 the length of wave (1) black. With corrections being time consuming this mid term target is probably still weeks away.
At 450.14 primary wave 3 would reach equality in length with primary wave 1. This long term target is still months away.
Within wave iii pink no second wave correction may move beyond the start of the first wave. This wave count is invalidated with movement above 1,266.98.
I have two hourly wave counts for you today. They differ in the degree of labeling for most recent downwards movement.
Main Hourly Wave Count.
Sideways movement labeled in last analysis as a triangle did not complete the final upwards wave. The triangle did not invalidate, but it does not look complete on the 5 minute chart.
Wave i orange looks like may be seen as a nice five wave impulse on the 5 minute chart. Subdivisions fit this main hourly wave count a little better than the alternate below. This main hourly wave count has a higher probability.
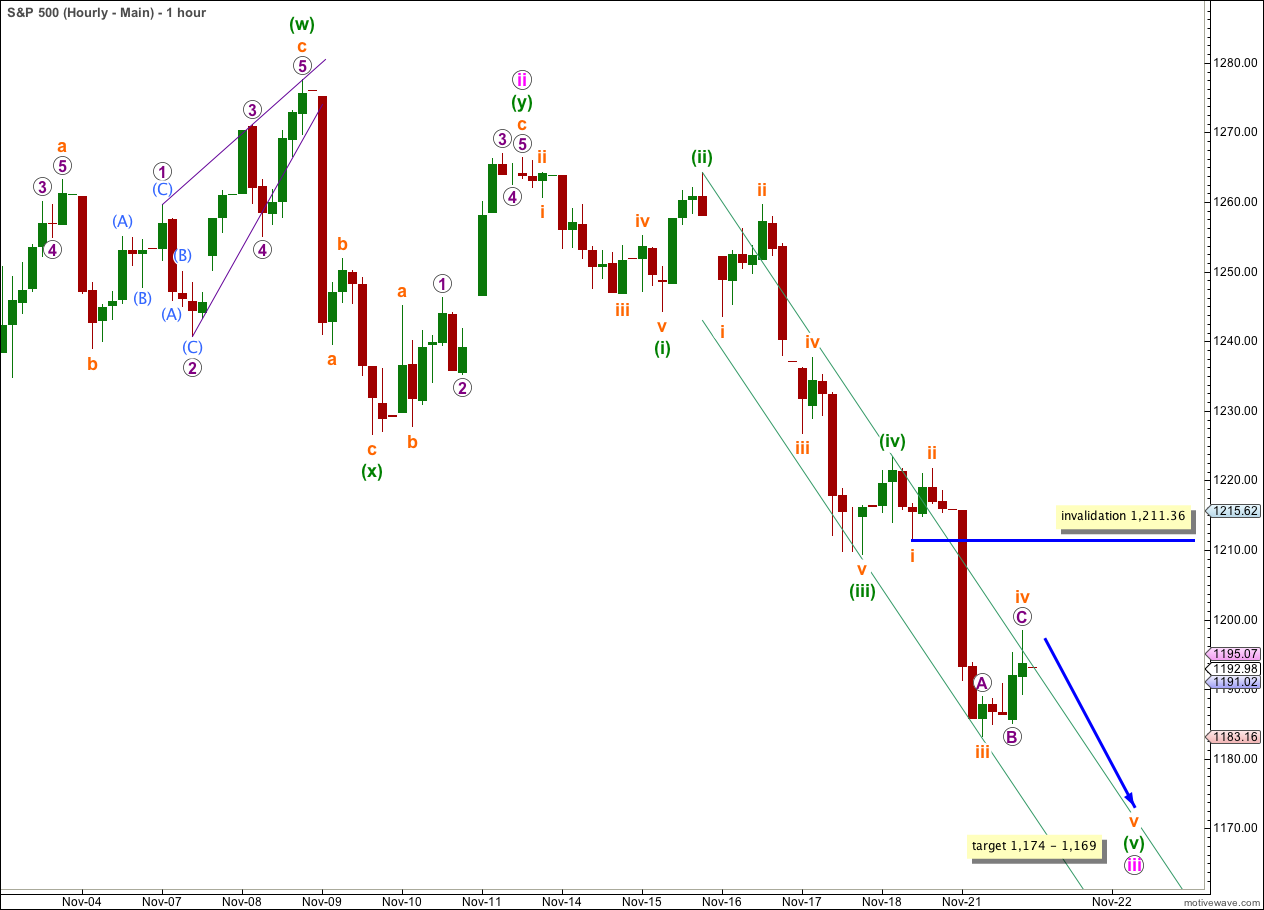
This main wave count sees the S&P as just about to complete the very last wave down within wave iii pink.
Within wave iii pink wave (iii) green is 2.83 points short of 2.618 the length of wave (i) green. At 1,169 wave (v) green would reach equality in length with wave (iii) green. However, because there is already a Fibonacci ratio between waves (i) and (iii) green the probability that we shall also see a Fibonacci ratio between wave (v) green and either of (i) or (iii) is low.
Within wave (v) green there is no Fibonacci ratio between waves iii and i orange. It is more likely then that we shall see a Fibonacci ratio between wave v orange and either of i or iii orange. At 1,174 wave v orange would reach 0.618 the length of wave iii orange.
We should favour the upper edge of the target zone for wave iii pink to end.
The parallel channel drawn about downwards movement indicates however that it may have just ended. This channel favours the alternate hourly wave count.
When markets open tomorrow any further upwards movement of wave iv orange may not move into wave i orange price territory. This wave count is invalidated with movement above 1,211.36.
When wave iii pink is complete then we may move the invalidation point downwards to the low of wave i pink at 1,215.42.
Alternate Hourly Wave Count.
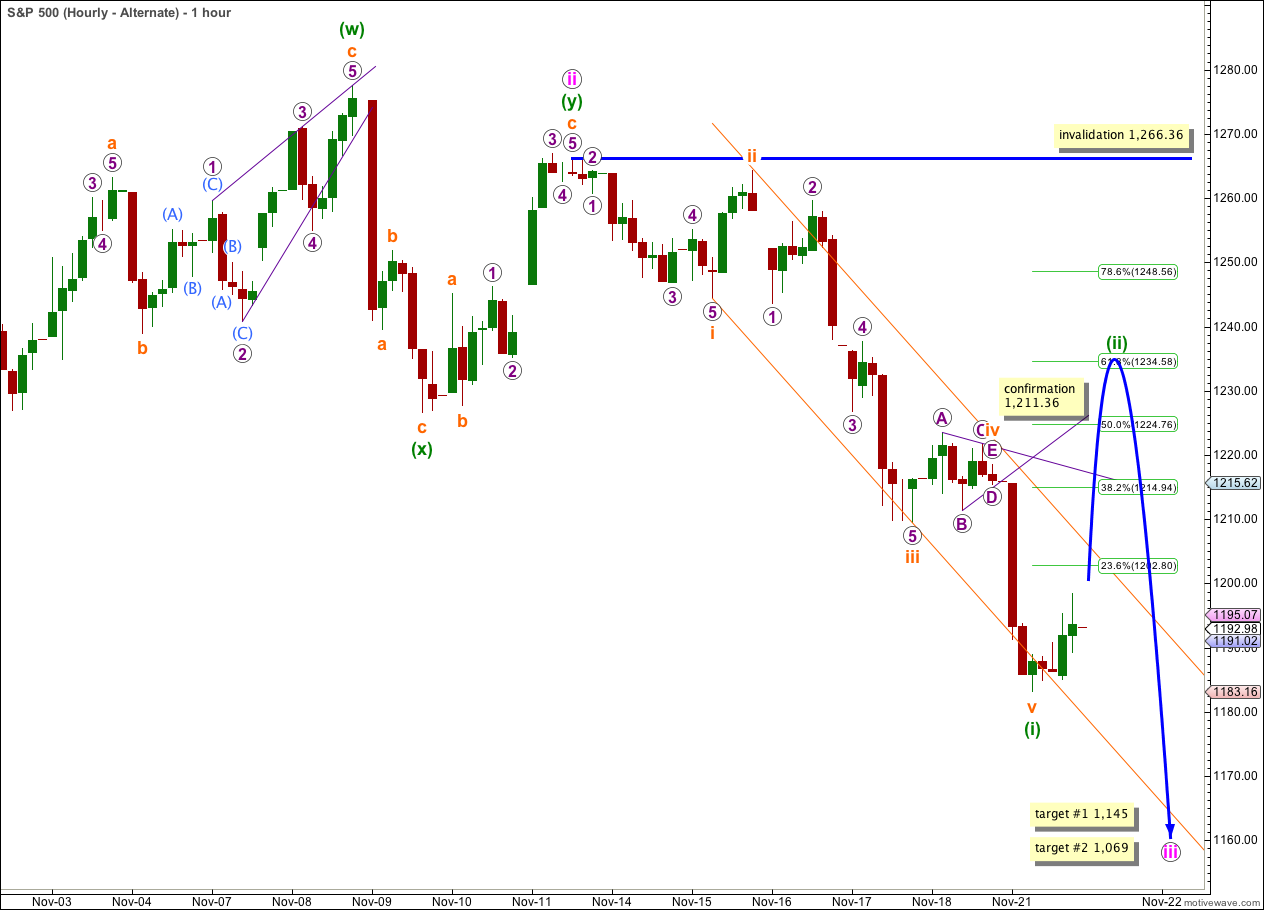
If we move the degree of labeling for most recent movement down one degree then wave (i) green within wave iii pink may be complete.
This alternate also looks at the idea that there was a triangle in a fourth wave position, with a very short E wave. This is possible, but the subdivision of wave B of the triangle does not quite look right on the 5 minute chart.
If price moves above 1,211.36 tomorrow then we may be seeing another second wave correction. This would mean that the strongest downwards movement is yet to come within wave 1 blue.
We may expect wave (ii) green to correct to about the 0.618 Fibonacci ratio of wave (i) green at 1,234.58.
Wave (ii) green may not move beyond the start of wave (i) green. This wave count is invalidated with movement above 1,266.36.
The parallel channel indicates that a five wave impulse has just ended. This channel favours this alternate hourly wave count.
Alternate Daily Wave Count.
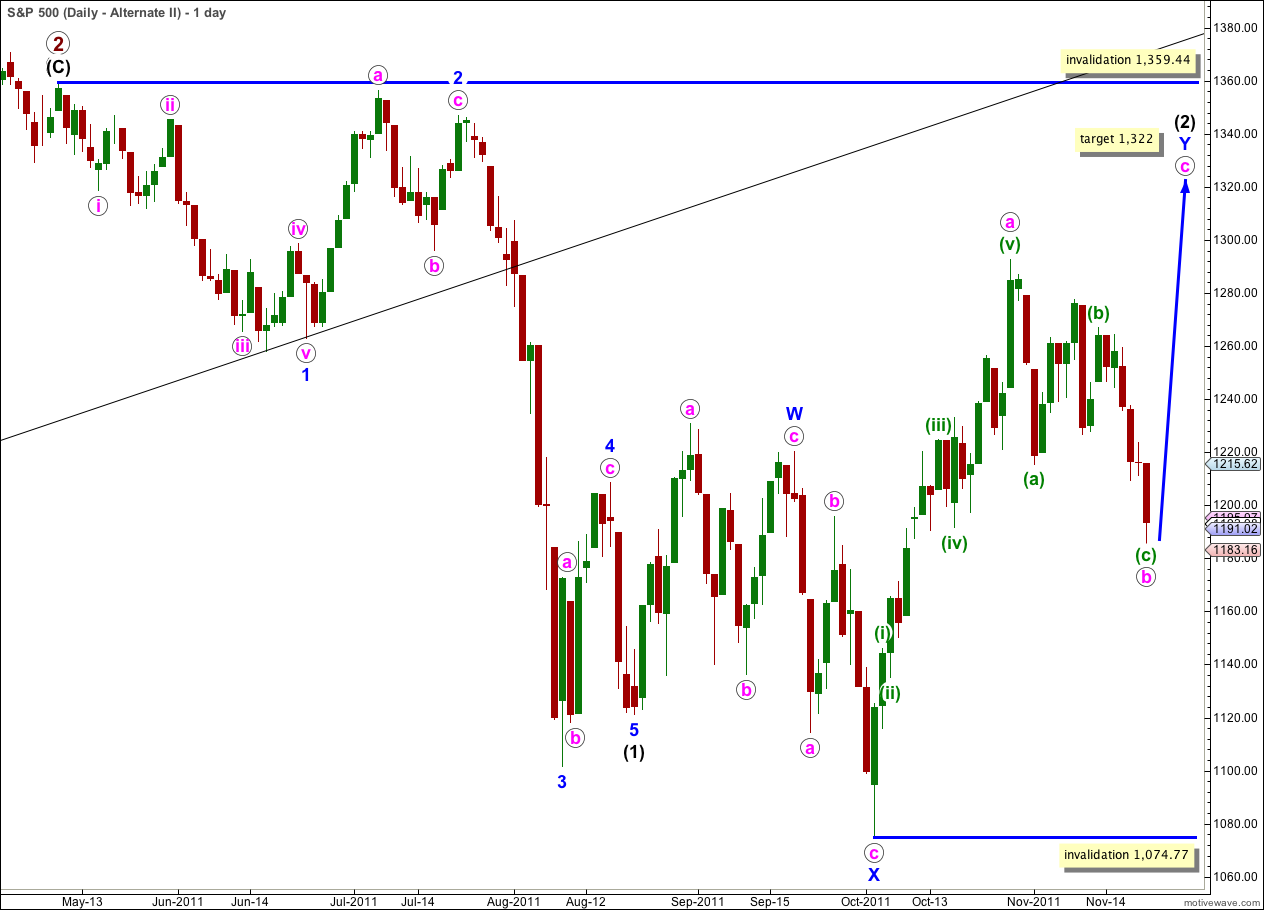
It remains technically possible that wave (2) black is incomplete and we may yet see price move above 1,292.66 in the mid term.
In the short term wave b pink within the zigzag of wave Y blue may have completed a three wave structure. Wave c pink upwards may begin.
Wave (2) black may not move beyond the start of wave (1) black. This wave count is invalidated with movement above 1,359.44.
This wave count does not have as good a look as the main wave count as wave Y blue is significantly out of proportion to wave W blue. However, this only reduces the probability of this wave count and it does not invalidate it.
The subdivisions on the hourly chart are exactly the same as for the main wave count. 1-2-3 and a-b-c have the same subdivisions. The targets and invalidation points for the short term are the same.