
Elliott Wave chart analysis for the S&P 500 for 18th November, 2011. Please click on the charts below to enlarge.
Last analysis expected a little downwards movement (just over 2 points) before a small fourth wave correction began. The correction began at the open of Friday’s session and we did not see any downwards movement first. Price remains well below the invalidation point on the hourly chart.
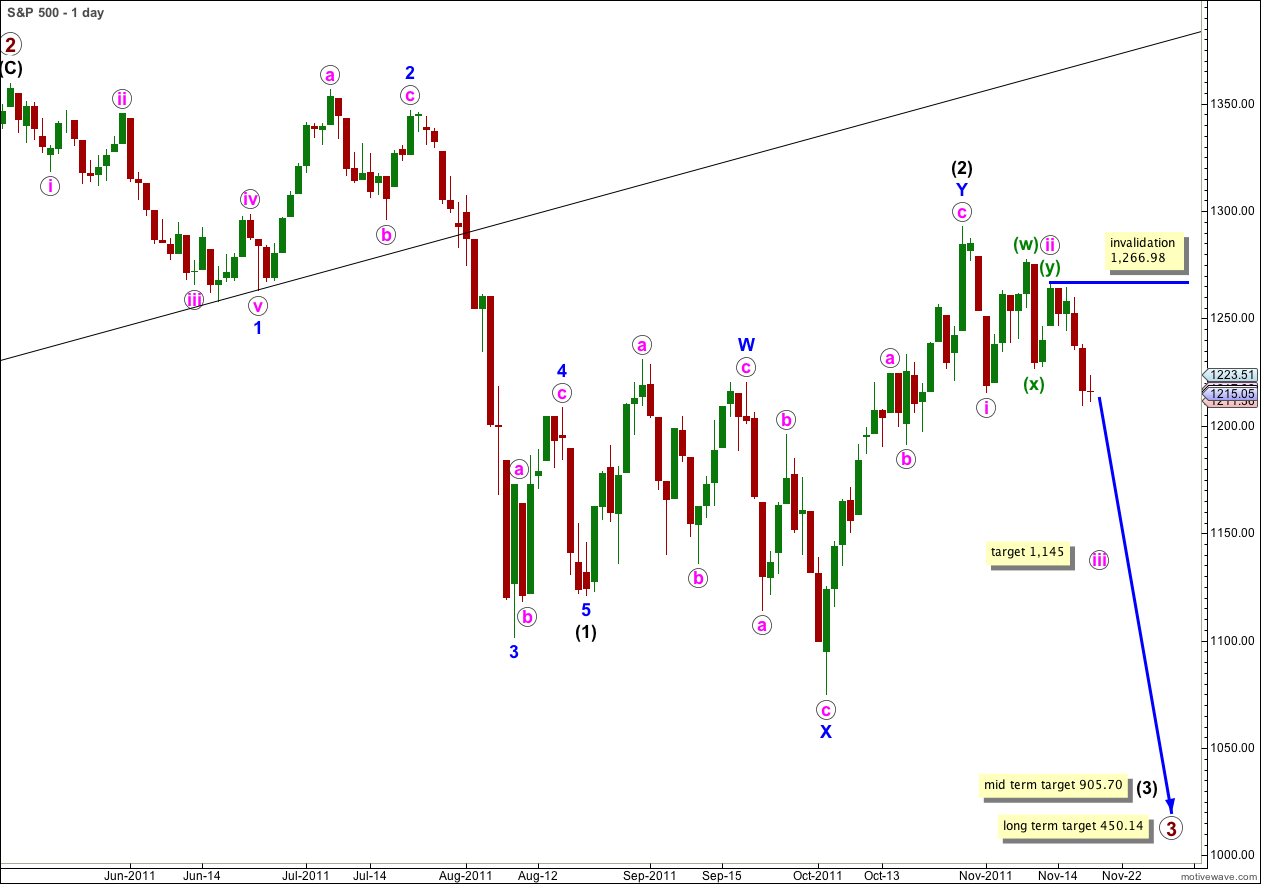
Within wave (3) black wave 1 blue is incomplete. Within wave 1 blue wave iii pink is incomplete. At 1,145 wave iii pink would reach 1.618 the length of wave i pink.
When wave 1 blue is complete we shall expect wave 2 blue to move price higher. At that stage the invalidation point must move to the start of wave 1 blue, and the start of wave (3) black, at 1,292.66.
Targets remain the same. At 905.70 wave (3) black will reach 1.618 the length of wave (1) black. With corrections being time consuming this mid term target is probably still weeks away.
At 450.14 primary wave 3 would reach equality in length with primary wave 1. This long term target is still months away.
Within wave iii pink no second wave correction may move beyond the start of the first wave. This wave count is invalidated with movement above 1,266.98.
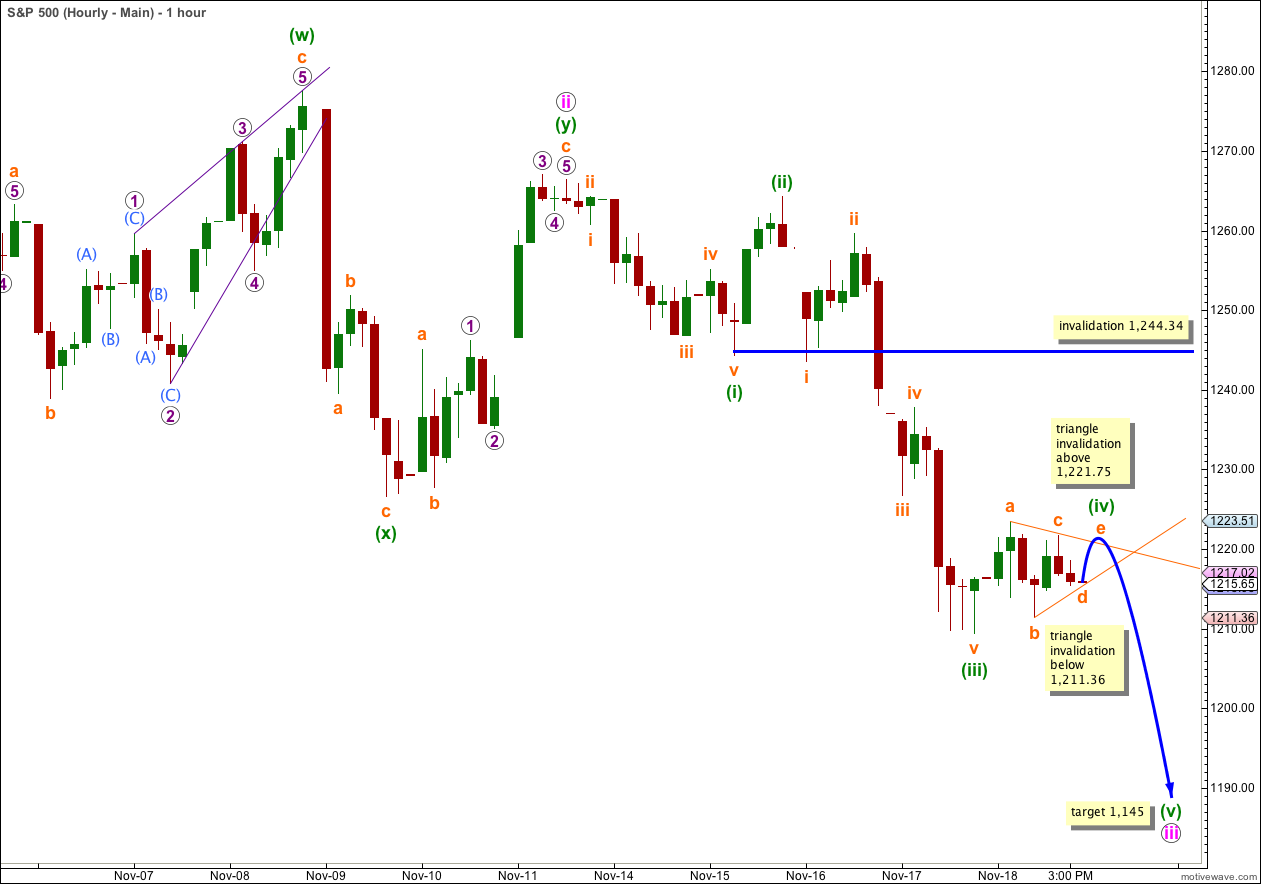
Wave (iii) green is a complete five wave structure. Ratios within wave (iii) green are: wave iii orange is just 0.69 points short of 1.618 the length of wave i orange, and wave v orange has no Fibonacci ratio to either of i or iii orange.
Wave (iv) green looks so far like a small triangle. It may also evolve as a double or triple flat or combination. Wave b orange is an 86% correction of wave a orange and this cannot be a flat correction (flats require b waves to be at least 90% of a waves). A triangle is more likely. Wave c orange is also an 86% correction of wave a orange. So far wave d orange is probably incomplete and we may see a little further downwards movement to end wave d orange.
This triangle looks to be a contracting triangle, but it may also develop as a barrier triangle. Wave d orange may not move beyond the end of wave b orange below 1,211.36 for a contracting triangle. For a barrier triangle wave d should end about the same level as wave b and in practice may end very slightly below this point. This means unfortunately that the lower invalidation point for the triangle at 1,211.36 may be very slightly breached in the case of a barrier triangle, but only by a very small amount.
For both a barrier and contracting triangle wave e may not move beyond the end of wave c. If I have labeled this triangle correctly (and I have labeled it as I have because of the typical wave lengths and correct subdivisions on the 5 minute chart) then wave e may not move above 1,221.75. This upper triangle invalidation point may not be breached by even a fraction of a point for the triangle to remain valid.
If the triangle remains valid and waves d and e orange complete then we shall have an extremely high probability of knowing the next movement out of the triangle will be a sharp downwards movement for wave (v) green. Wave (v) green may be at least as long as the widest part of the triangle which is 14.08 points. It is likely to reach equality with wave (i) green which was 22.02 points. It may be longer.
If the triangle remains valid then keep drawing in its trend lines: from a to c, and from b to d. Extend the trend lines outwards. At the point in time at which these trend lines cross over expect a trend change, which is most likely to be the end of wave (v) green and iii pink.
When wave (iv) green is complete I can refine the target downwards for wave (v) green to complete wave iii pink.
Wave (iv) green may not move into wave (i) green price territory. This wave count is invalidated with movement above 1,244.34.
If you are interested in familiarising yourself with rules for triangles see pages 90 and 91 of “Elliott Wave Principle” by Frost and Prechter, 10th edition.
Alternate Daily Wave Count.
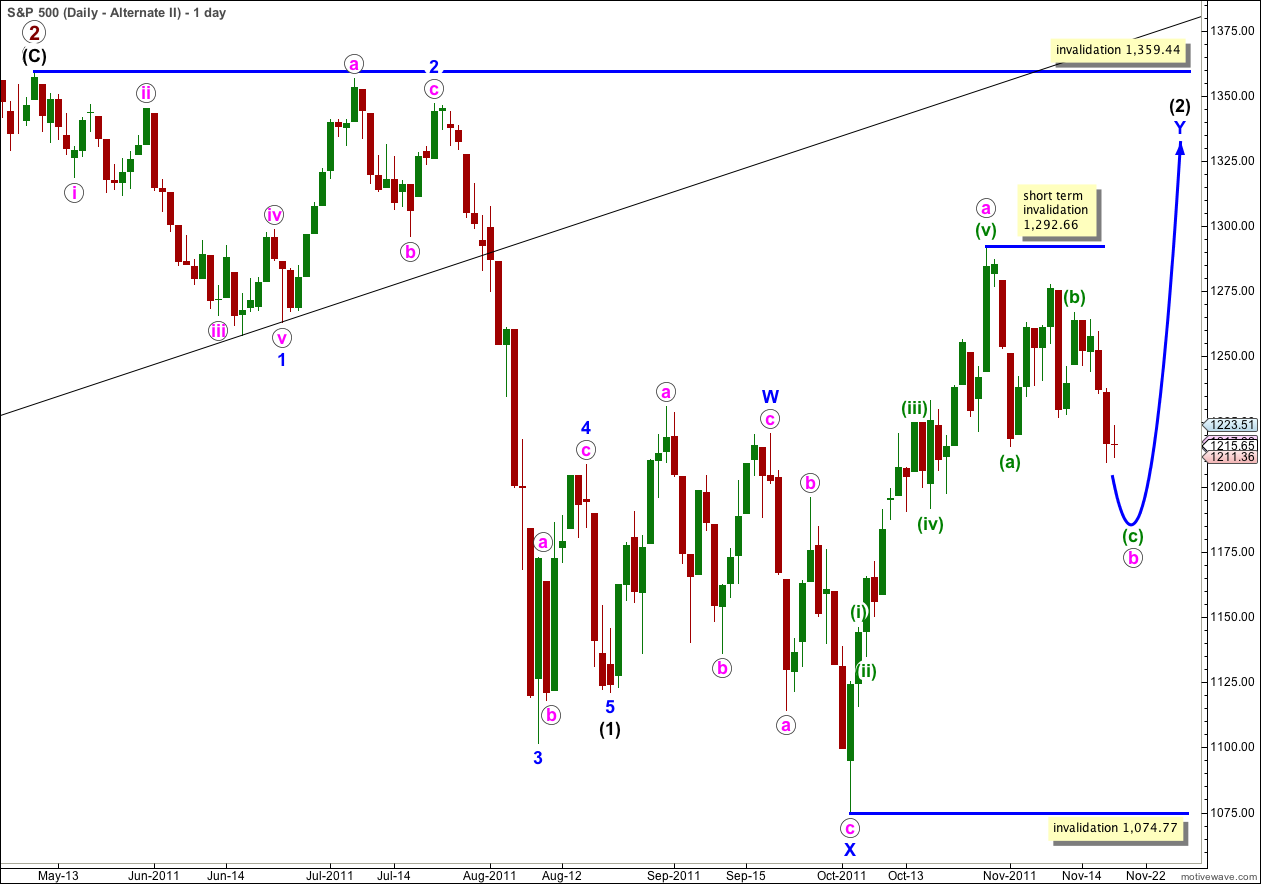
It remains technically possible that wave (2) black is incomplete and we may yet see price move above 1,292.66 in the mid term.
In the short term wave b pink within the zigzag of wave Y blue must complete a three wave structure downwards. This is most likely to make a new low below the end of wave (a) green at 1,215.42 but it does not have to.
Wave (2) black may not move beyond the start of wave (1) black. This wave count is invalidated with movement above 1,359.44.
This wave count does not have as good a look as the main wave count as wave Y blue is significantly out of proportion to wave W blue. However, this only reduces the probability of this wave count and it does not invalidate it.
The subdivisions on the hourly chart are exactly the same as for the main wave count. 1-2-3 and a-b-c have the same subdivisions. The targets and invalidation points for the short term are the same.