
Elliott Wave chart analysis for the S&P 500 for 16th November, 2011. Please click on the charts below to enlarge.
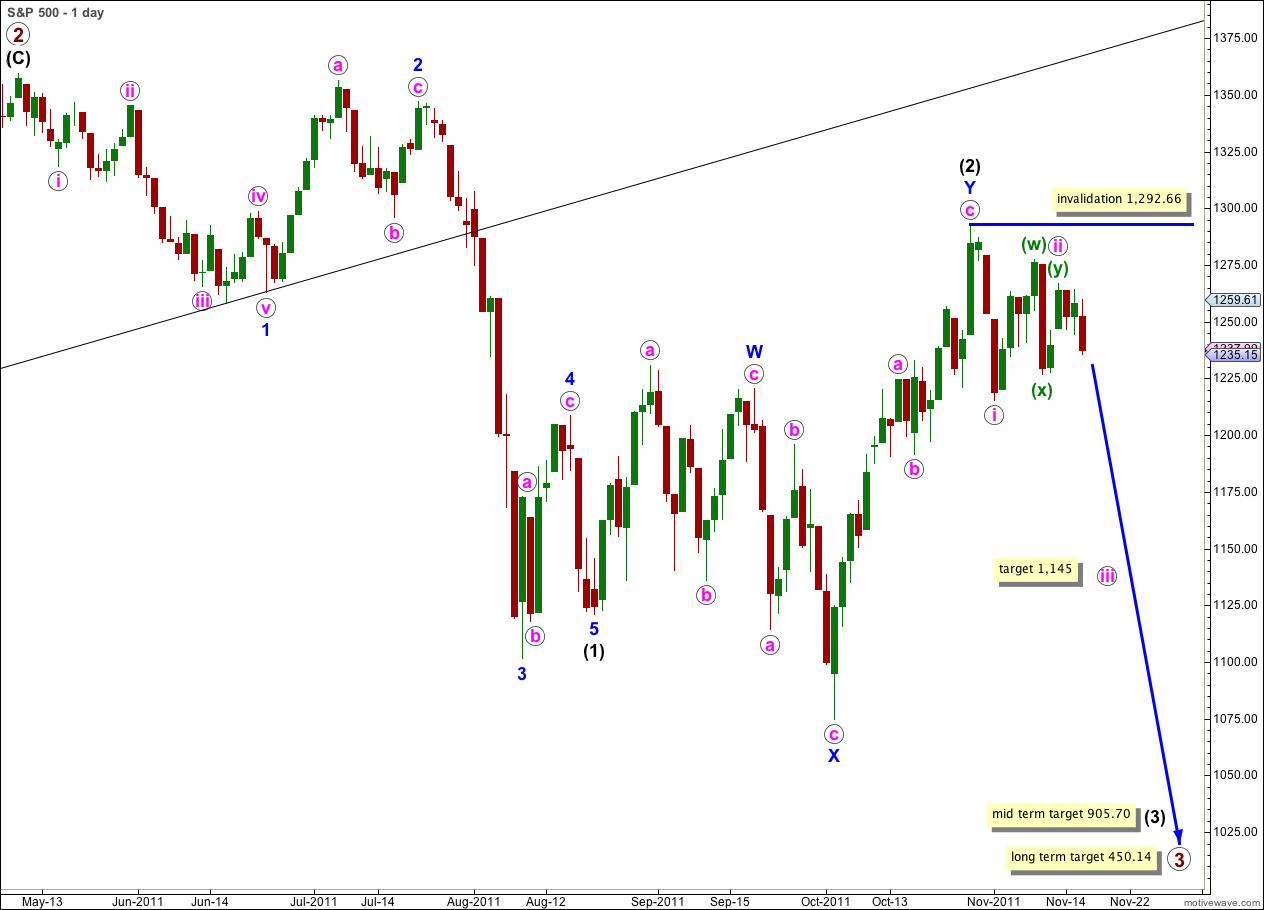
Movement below 1,244.34 has confirmed our alternate hourly count and invalidated the main hourly wave count. It is very likely that the S&P 500 will continue lower over the next few days with strong downwards movement.
Pink wave i lasted a Fibonacci 3 days and pink wave ii lasted a Fibonacci 8 days. So far pink wave iii has lasted 3 days. If it lasts a Fibonacci 8 days then it may end next Thursday, November 24th.
At 1,145 wave iii pink would reach 1.618 the length of wave i pink. If price continues falling through this first target the next expectation would be at 2.618 the length of wave i pink at 1,069.
Targets remain the same. At 905.70 wave (3) black will reach 1.618 the length of wave (1) black. With corrections being time consuming this mid term target is probably still at least two weeks away.
At 450.14 primary wave 3 would reach equality in length with primary wave 1. This long term target is still months away.
Wave ii pink may not move beyond the start of wave i pink. This wave count is invalidated with movement above 1,292.66. When wave iii pink moves beyond the end of wave i pink below 1,215.42 then a core Elliott wave rule will be met. At that stage we may have increased confidence that the third wave down is underway and I will move the invalidation point on the daily chart down to the start of wave iii pink at 1,266.98.
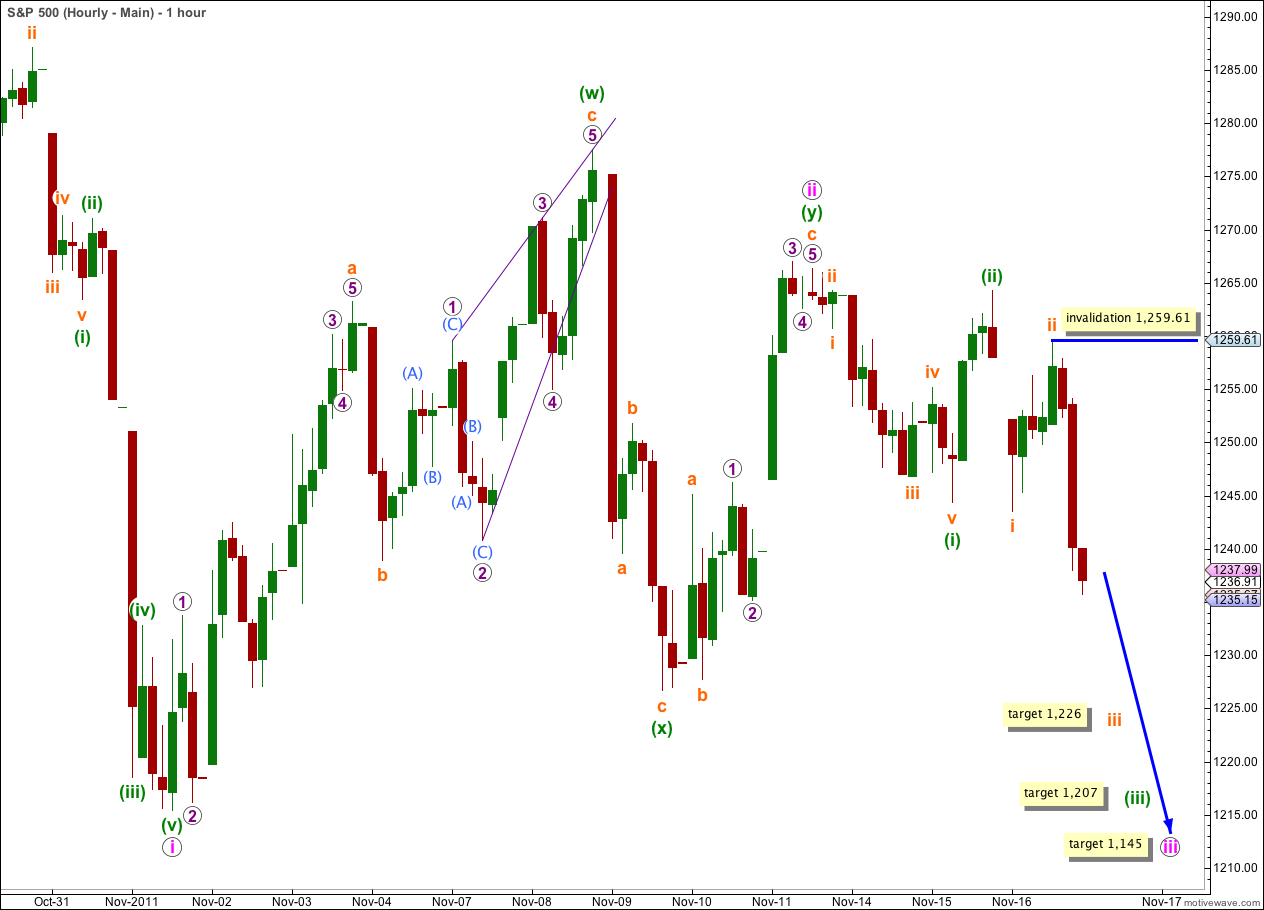
This was yesterday’s alternate hourly wave count. Price movement below 1,244.34 has confirmed it.
Movement to a new low below the low of i pink at 1,215.42 would provide further confidence in this wave count.
We have a series of overlapping first and second waves. This expects strong downwards movement to come as the middle of a third wave unfolds.
At 1,226 wave iii orange would reach 1.618 the length of wave i orange. This target may be reached within one to two more days.
At 1,207 wave (iii) green would reach 2.618 the length of wave (i) green. This target may be reached within a few days.
At 1,145 wave iii pink would reach 1.618 the length of wave i pink. This target may be reached by next Thursday.
When wave iii pink is complete we may expect a fourth wave correction which may last about a week or so, if it is to be in proportion to its counterpart wave ii pink. Wave iv pink may not move into wave i pink price territory and price should not move above 1,215.42 at that stage.
Within wave iii orange no second wave correction may move beyond the start of its first wave. This wave count is invalidated with movement above 1,259.61.
Price has met some resistance to end Wednesday’s session; we can draw a trend line from the low of i pink to the low of (x) green and extend it to the right. On the 5 minute chart we have a complete impulse. This is probably wave 1 purple within wave iii orange. Tomorrow’s session may begin with some upwards movement for another second wave before price turns and plummets through resistance in the middle of a third wave.
Alternate Wave Count.
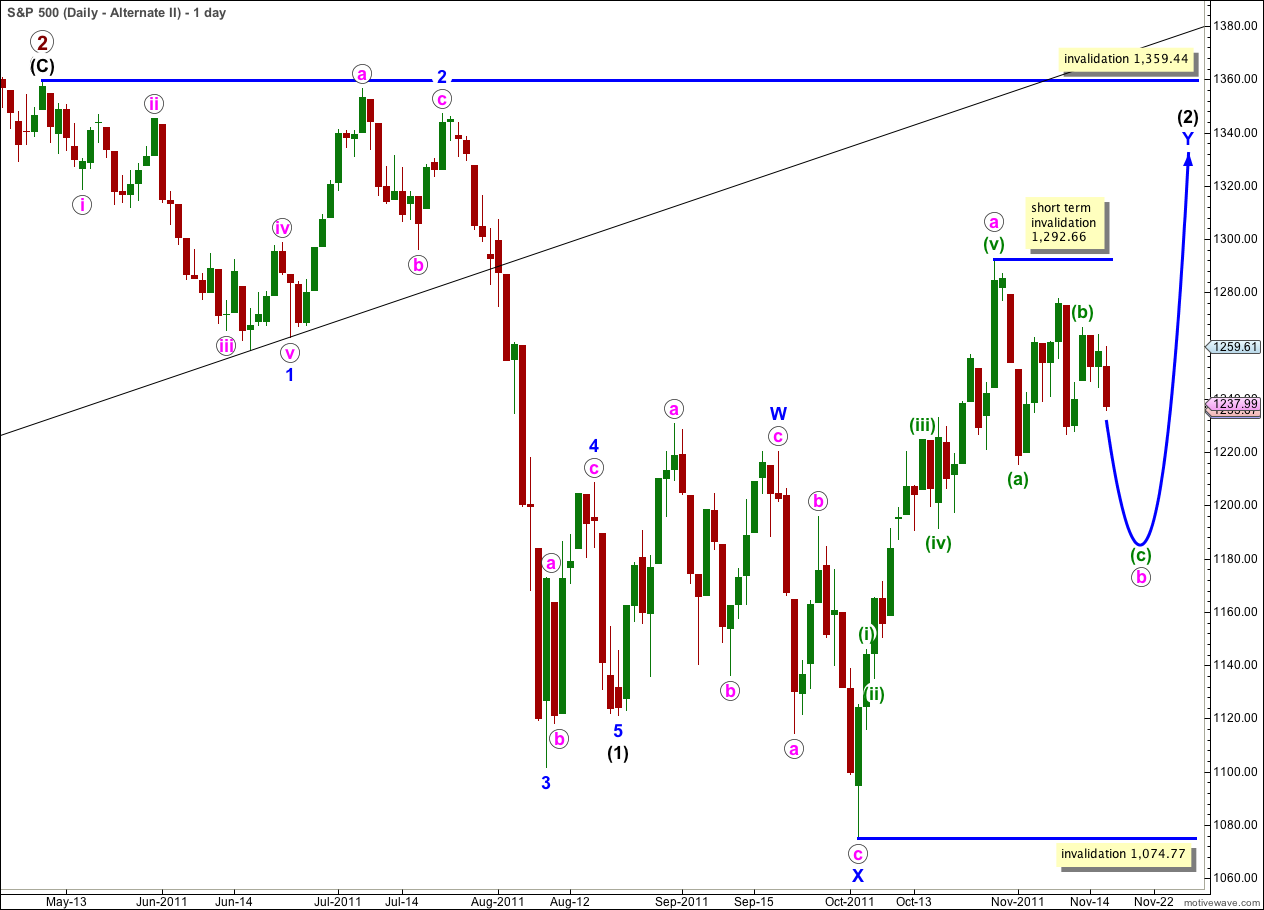
It remains technically possible that wave (2) black is incomplete and we may yet see price move above 1,292.66 in the mid term.
In the short term wave b pink within the zigzag of wave Y blue must complete a three wave structure downwards. This is most likely to make a new low below the end of wave (a) green at 1,215.42 but it does not have to.
Wave (2) black may not move beyond the start of wave (1) black. This wave count is invalidated with movement above 1,359.44.
This wave count does not have as good a look as the main wave count as wave Y blue is significantly out of proportion to wave W blue. However, this only reduces the probability of this wave count and it does not invalidate it.
The subdivisions on the hourly chart are exactly the same as for the main wave count. 1-2-3 and a-b-c have the same subdivisions. The targets and invalidation points are the same.