
Elliott Wave chart analysis for the S&P 500 for 15th November, 2011. Please click on the charts below to enlarge.
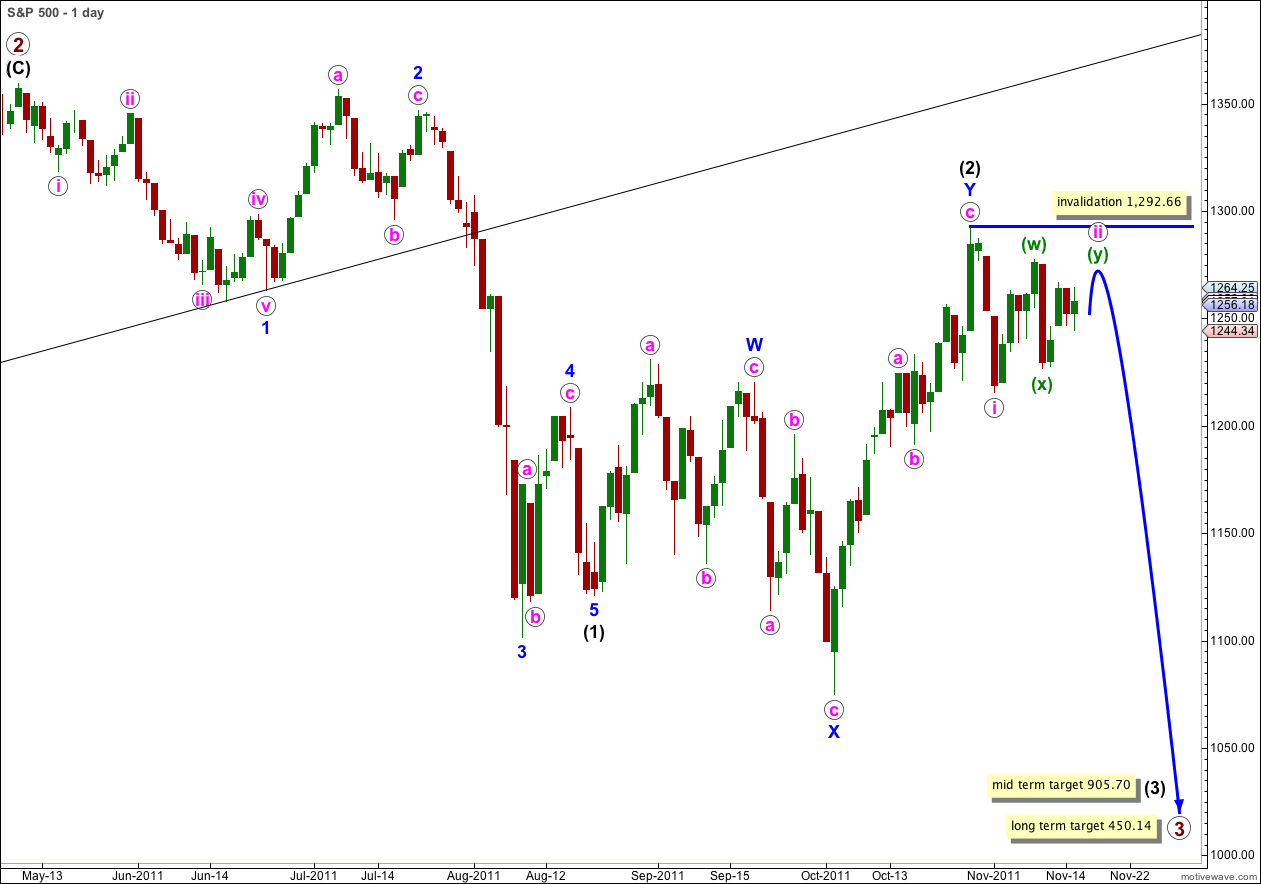
Although price has moved higher to end the session an early spike downwards breached our short term invalidation point on the hourly chart first. I have two hourly wave counts for us today.
Wave ii pink may have yet one or two more days of upwards movement before it is complete, or it could be over. If we see price movement below 1,244.34 tomorrow then it is likely that wave ii pink is complete and wave iii pink down has begun.
Targets remain the same. At 905.70 wave (3) black will reach 1.618 the length of wave (1) black. With corrections being time consuming this mid term target is probably still at least two weeks away.
At 450.14 primary wave 3 would reach equality in length with primary wave 1. This long term target is still months away.
Wave ii pink may not move beyond the start of wave i pink. This wave count is invalidated with movement above 1,292.66.
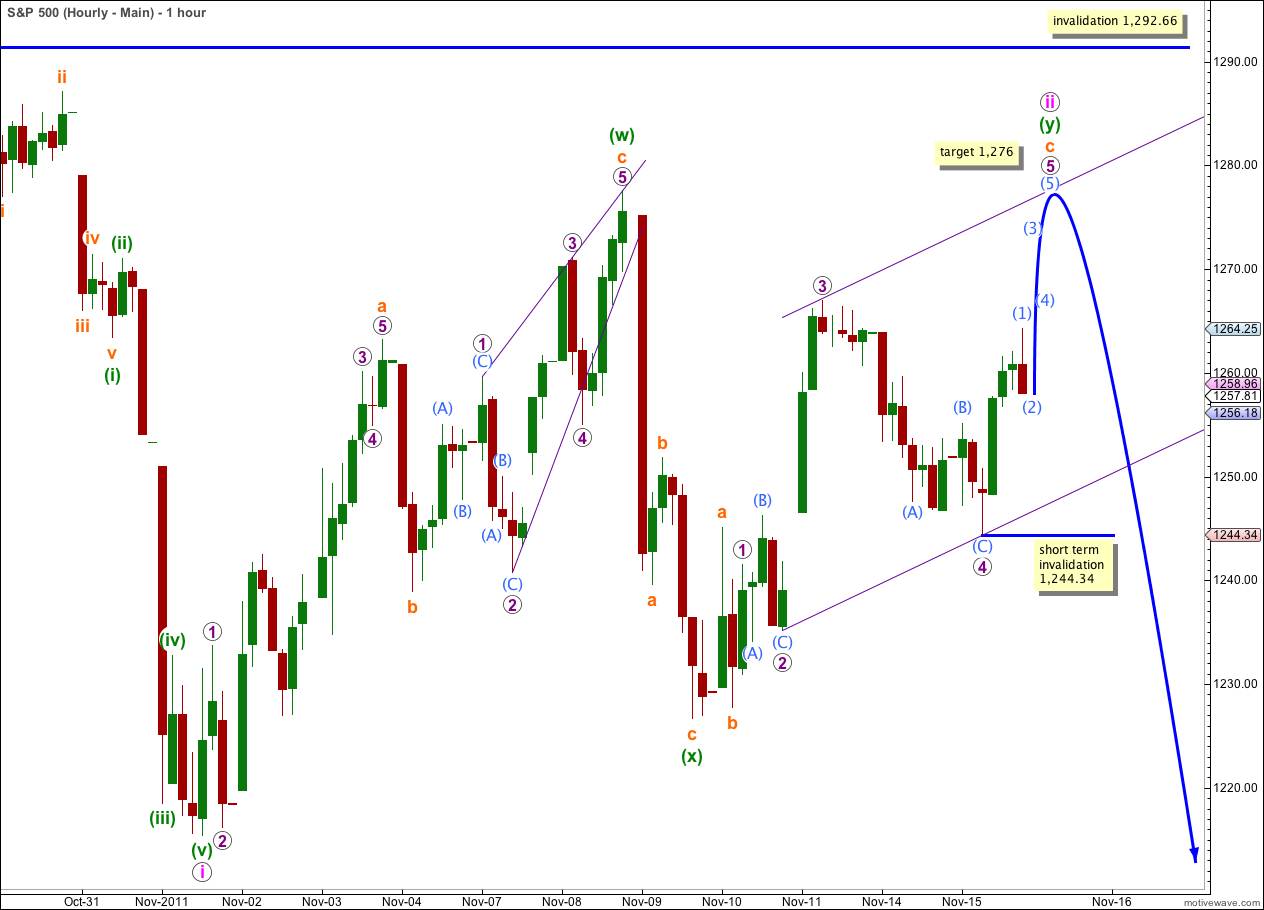
The end of wave 1 purple may be moved a little lower, but with this wave count the subdivision of wave 1 purple is not as satisfactory on the 5 minute chart. This reduces the probability of this wave count. Wave 4 purple remains above the price territory of wave 1 purple.
With wave 1 purple ending at 1,241.55 there is no Fibonacci ratio between waves 3 and 1 purple.
It would be likely for wave 5 purple to end about the upper edge of this parallel channel.
At 1,276 wave 5 purple would reach equality with wave 3 purple, and also wave c orange would reach 2.618 the length of wave a orange. This price point would also see wave (y) green move price slightly above the high labeled wave (w) green.
If price remains above 1,244.34 tomorrow and it makes a new high above wave (1) aqua at 1,264.25 then this is the wave count we should use.
If however price makes a new low below 1,244.34 tomorrow then we should use the alternate hourly wave count below.
Alternate Hourly Wave Count.
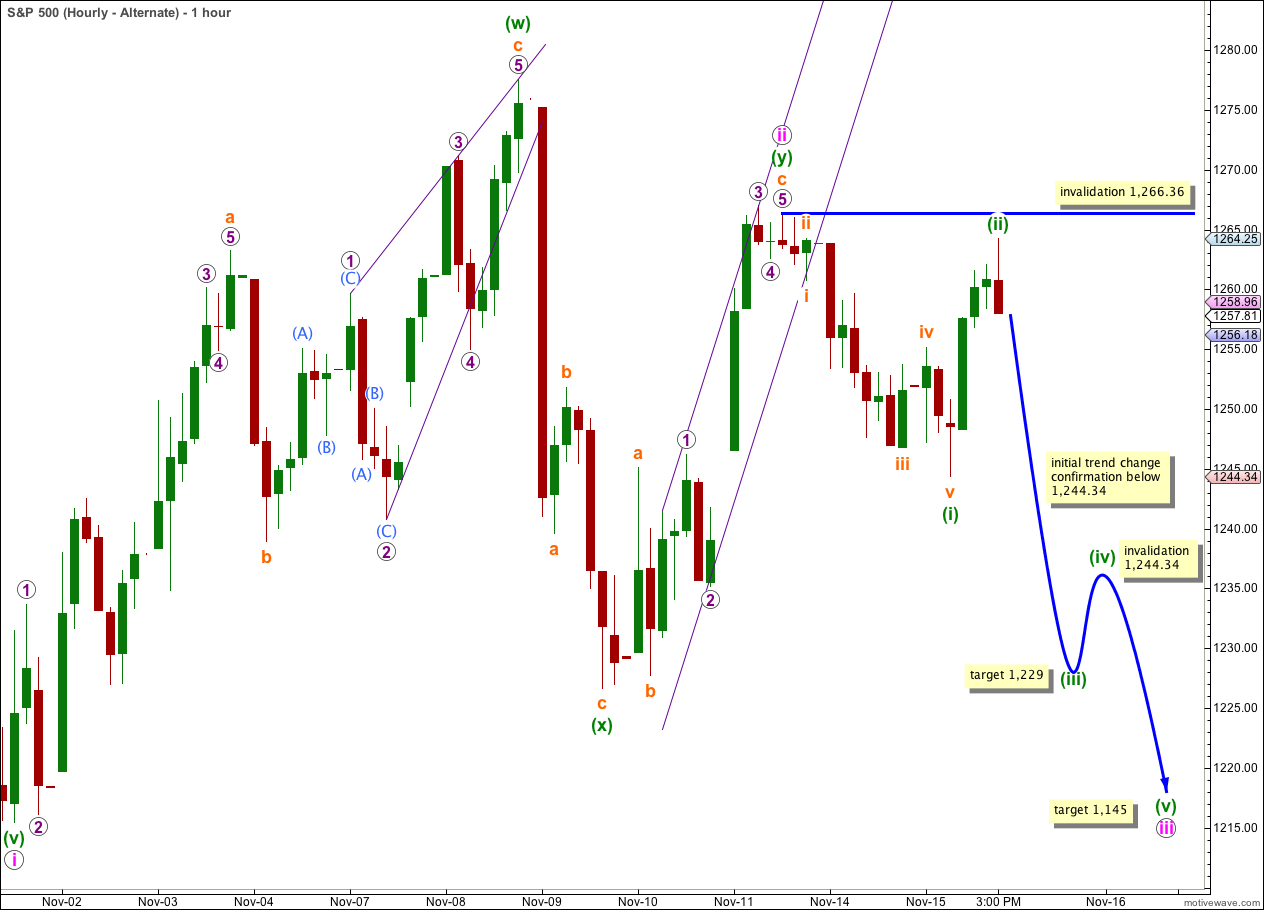
The subdivisions for this wave count have a better fit than for the first hourly wave count, but we should always assume that the trend remains the same until proved otherwise. At this stage we do not have confirmation of a trend change.
Wave (i) green is a good five wave impulse, and wave iii orange within it subdivides into an impulse.
Wave (ii) green on the 5 minute chart has a corrective wave count.
Within wave c orange wave 5 purple may have ended with a slight truncation. Ratios within wave c orange are: wave 3 purple is just 1.85 points short of 1.618 the length of wave 1 purple, and there is no Fibonacci ratio between wave 5 purple and either of 1 or 3 purple.
At 1,229 wave (iii) green would reach 1.618 the length of wave (i) green.
At 1,145 wave iii pink would reach 1.618 the length of wave i pink.
When wave (iii) green is complete then we may move the invalidation point down to the low labeled (i) green at 1,244.34.
Alternate Wave Count.
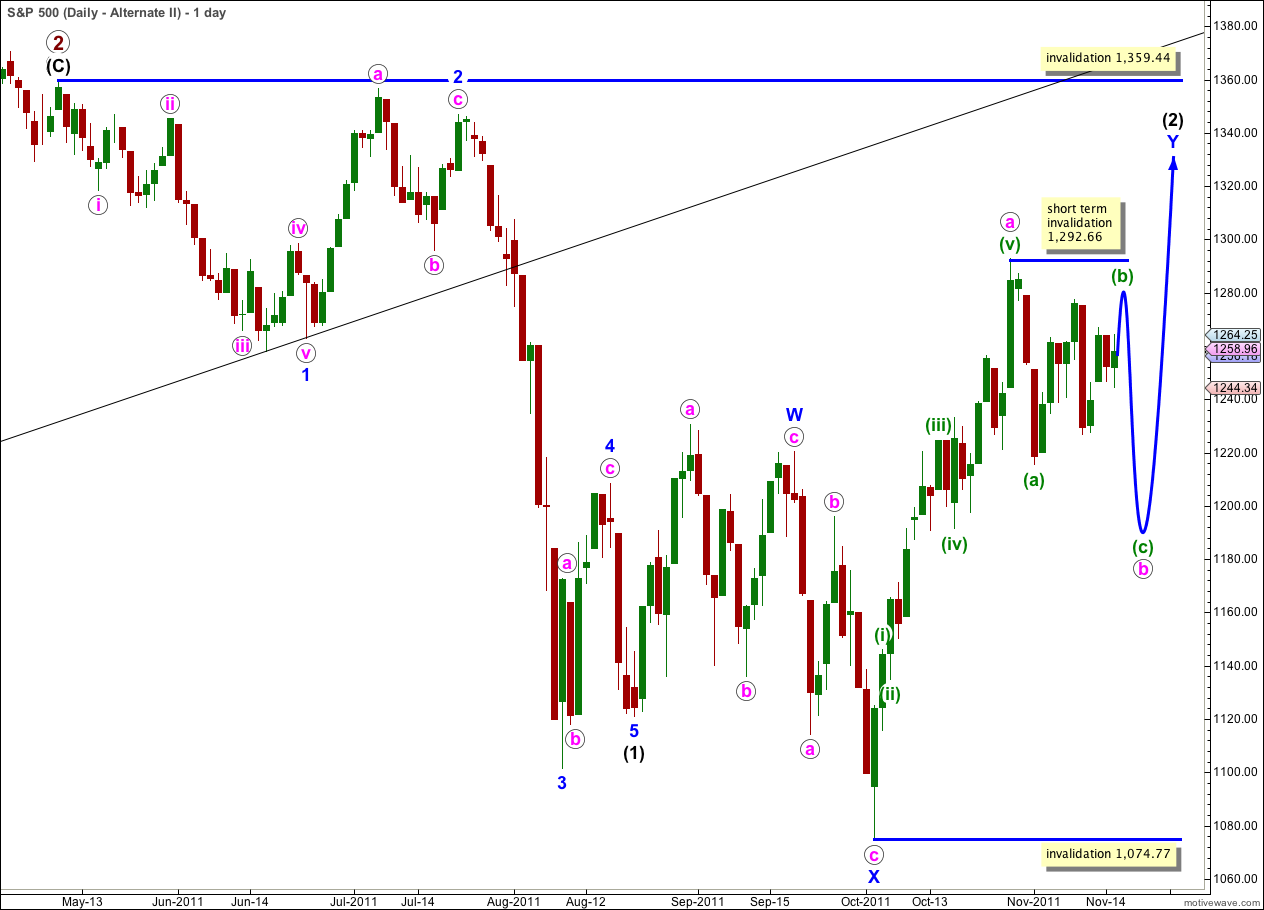
It remains technically possible that wave (2) black is incomplete and we may yet see price move above 1,292.66 in the mid term.
In the short term wave b pink within the zigzag of wave Y blue must complete a three wave structure downwards. This is most likely to make a new low below the end of wave (a) green at 1,215.42 but it does not have to.
Wave (2) black may not move beyond the start of wave (1) black. This wave count is invalidated with movement above 1,359.44.
This wave count does not have as good a look as the main wave count as wave Y blue is significantly out of proportion to wave W blue. However, this only reduces the probability of this wave count and it does not invalidate it.
The subdivisions on the hourly chart are exactly the same as for the main wave count. 1-2-3 and a-b-c have the same subdivisions. The targets and invalidation points are the same.