
Elliott Wave chart analysis for the S&P 500 for 10th November, 2011. Please click on the charts below to enlarge.
Price has remained below the short term invalidation point at 1,251.82 and we may have seen a small second wave correction unfold during Thursday’s session.
I have another alternate wave count today which sees movement above 1,251.82 as possible.
At this stage this main wave count has the best look and the best proportions. It has the highest probability.
When price makes a new low below the low of i pink at 1,251 a core Elliott wave rule will be met, that wave iii pink must move beyond the end of wave i pink. At that point we may have further confidence of a trend change.
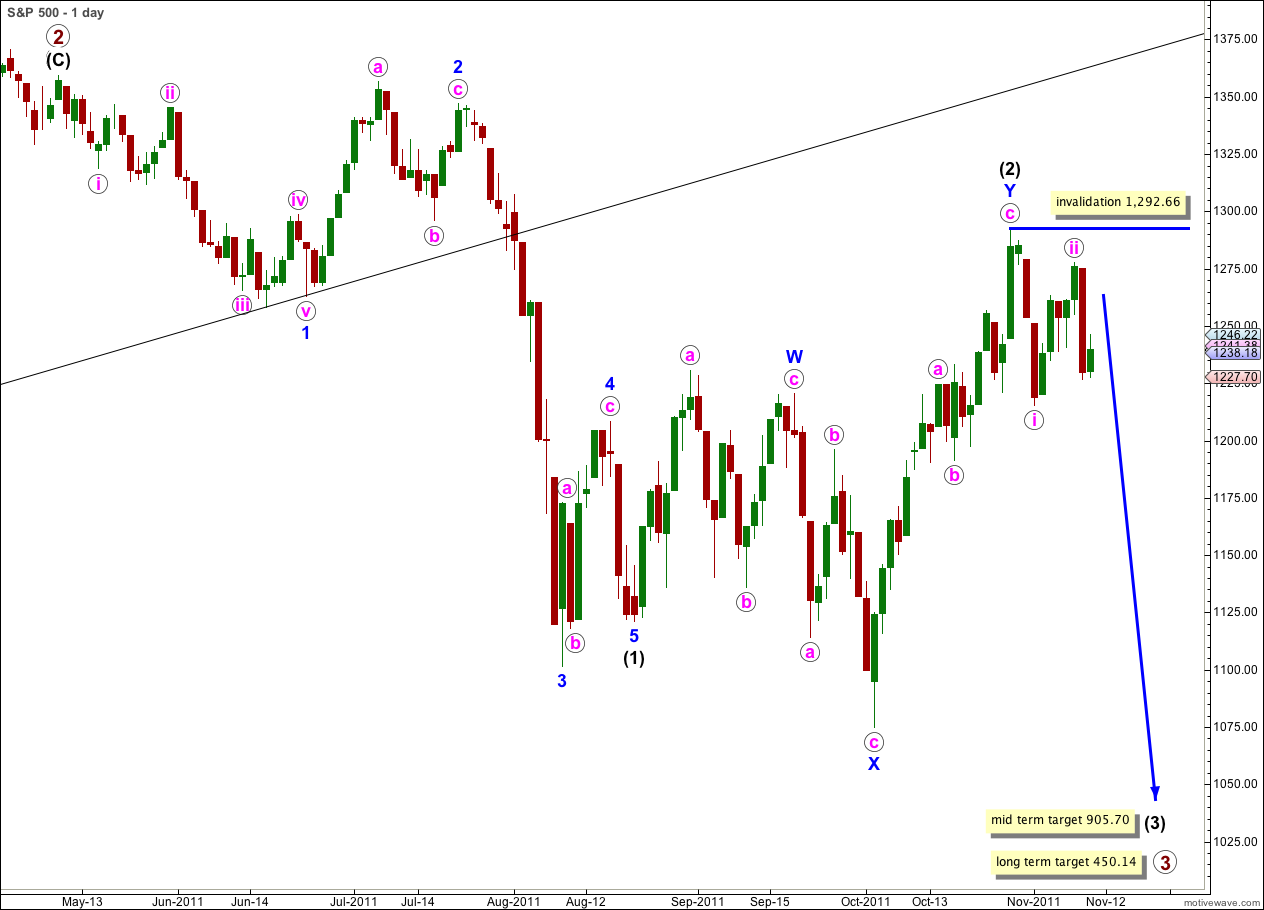
Only with movement below 1,074.77, the low labeled X blue, will we have full and final confirmation that black wave (3) is underway.
Targets remain the same. At 905.70 wave (3) black would reach 1.618 the length of wave (1) black. This mid term target is probably some weeks away.
At 450.14 primary wave 3 would reach equality with primary wave 1. This long term target is probably still a few months away.
Wave ii pink may not move beyond the start of wave i pink. This wave count is invalidated with movement above 1,292.66. When wave iii pink has moved beyond the end of wave i pink then we may move the invalidation point down to the start of wave iii pink at 1,277.55.
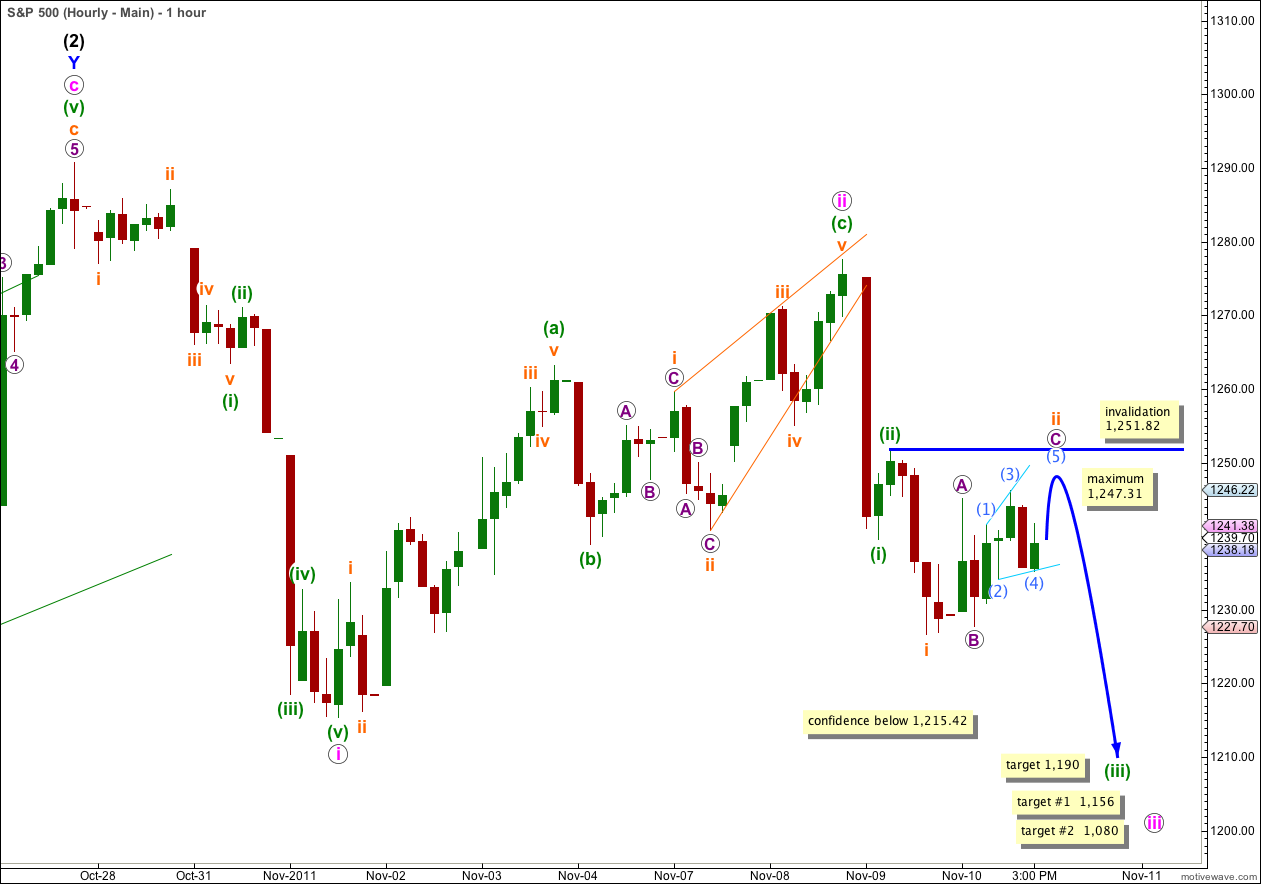
Upwards movement looks very corrective and has a corrective count. Wave ii orange looks like a flat correction. Wave C purple is an incomplete ending diagonal.
The ending diagonal has a third wave which is shorter than the first and this means wave (5) aqua is limited to no longer than equality with wave (3) aqua because the third wave can never be the shortest. At 1,247.31 wave (5) aqua would reach equality with wave (3) aqua.
When wave ii orange is complete we may expect wave iii orange within (iii) green within iii pink to begin. At 1,190 wave (iii) green would reach 1.618 the length of wave (i) green. If price moves through this first target then the next target would be at 1,158 where wave (iii) green would reach 2.618 the length of wave (i) green. Targets for wave (iii) green are short term but after today’s relatively time consuming correction are probably still a few days away.
At 1,156 wave iii pink would reach 1.618 the length of wave i pink. If price moves through this first target then the next target would be at 1,080 where wave iii pink would reach 2.618 the length of wave i pink. Targets for wave iii pink are short to mid term and may be reached by the end of next week.
Wave ii orange may not move beyond the start of wave i orange. This wave count is invalidated with movement above 1,247.31.
Hourly Alternate Wave Count.
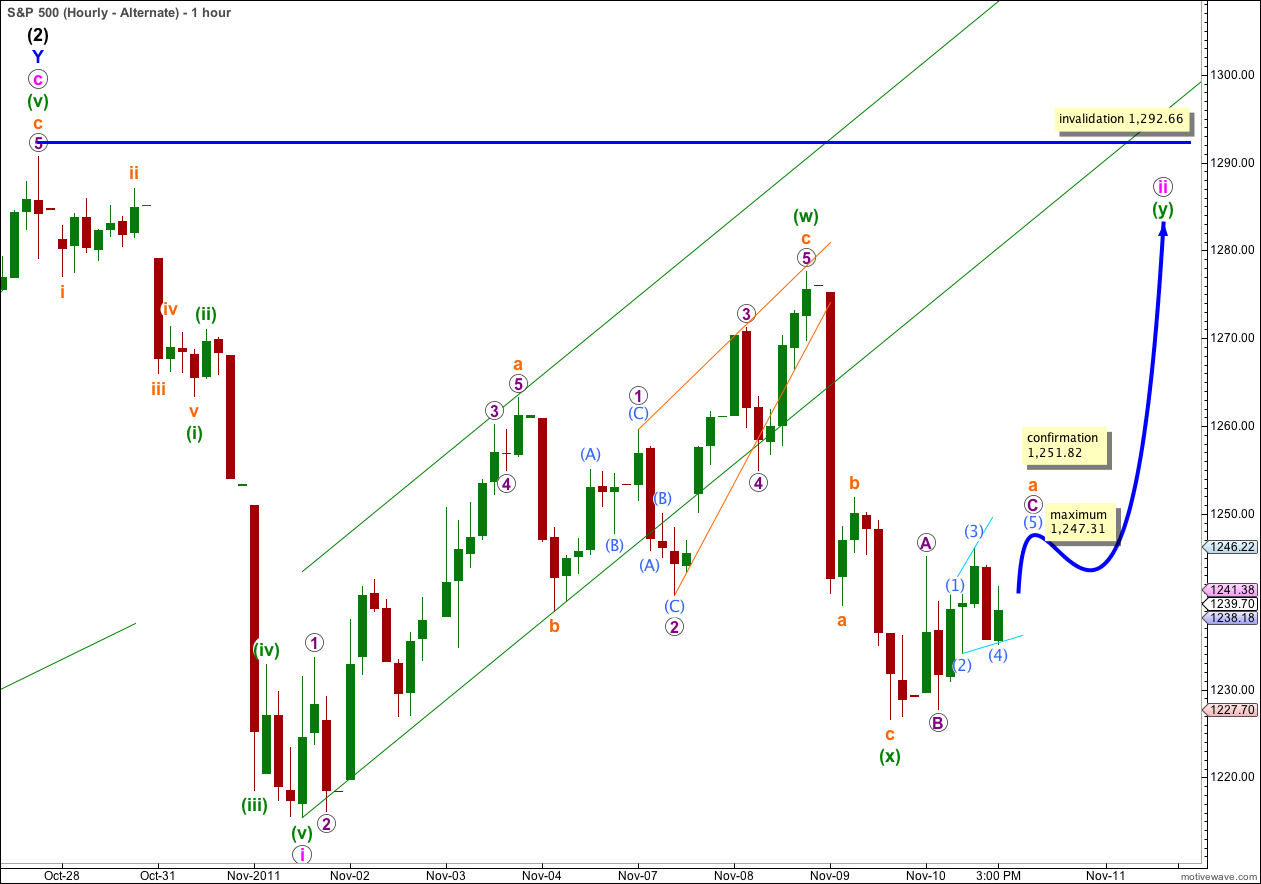
So far downwards movement is in a three wave structure. This may be an X wave to join two structures in a double for wave ii pink, which may still be incomplete.
This wave count has a low probability because it just does not have the right look. Wave ii pink is much larger in duration than wave i pink.
Wave (w) green is a zigzag and wave (y) green looks like it may be a flat correction. This possible structure for wave ii pink may be a double combination correction.
If price moves above 1,251.82 then at this stage this is the only possible wave count I can see which would explain upwards movement.
In the short term a diagonal structure needs to complete and wave (5) aqua may not be longer than equality with wave (3) aqua at 1,247.31.
This should be followed by at least a little downwards movement.
Wave ii pink may not move beyond the start of wave i pink. This wave count is invalidated with movement above 1,292.66.
There is no lower invalidation point for this wave count because in a flat correction wave B may move beyond the start of wave A.
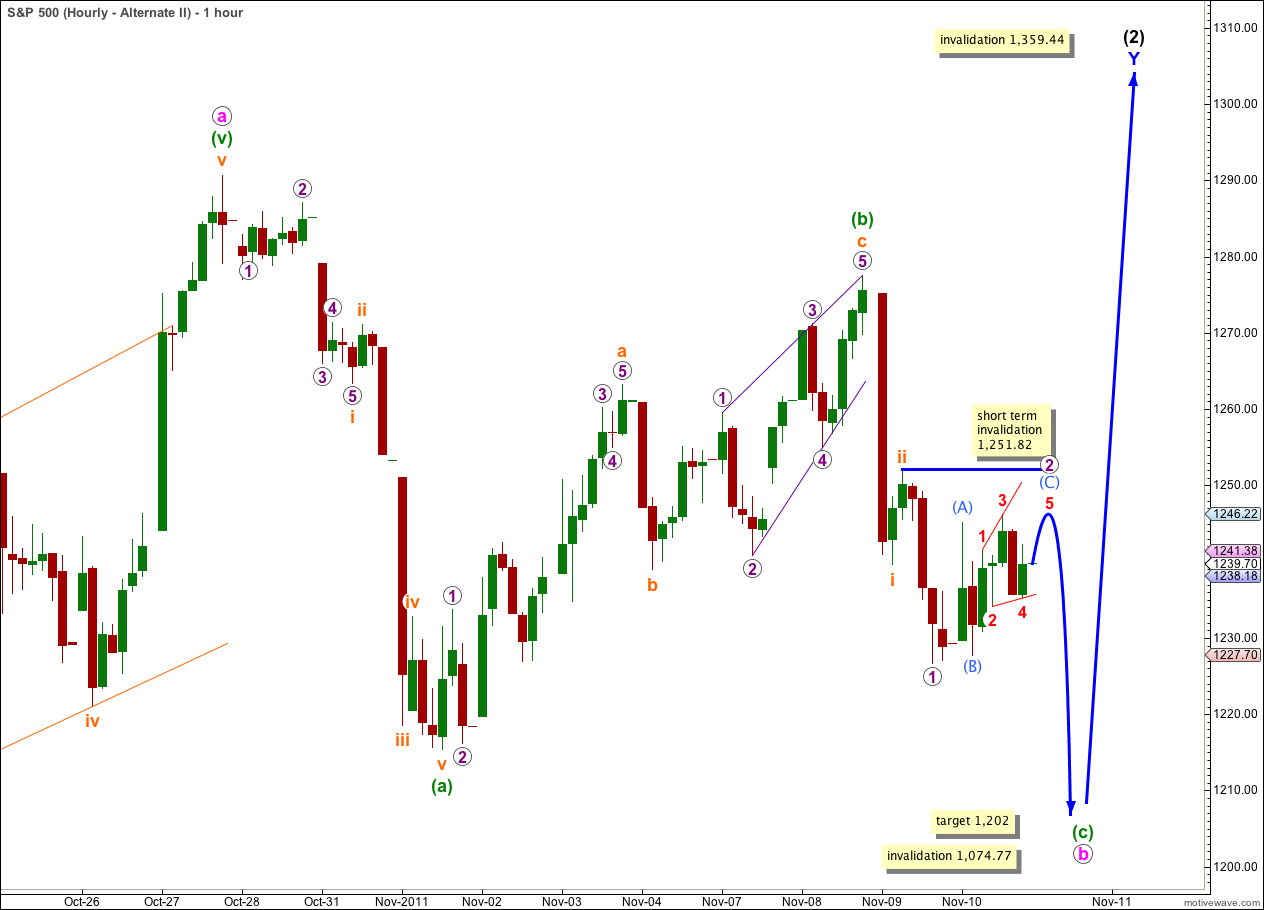
Alternate Wave Count.
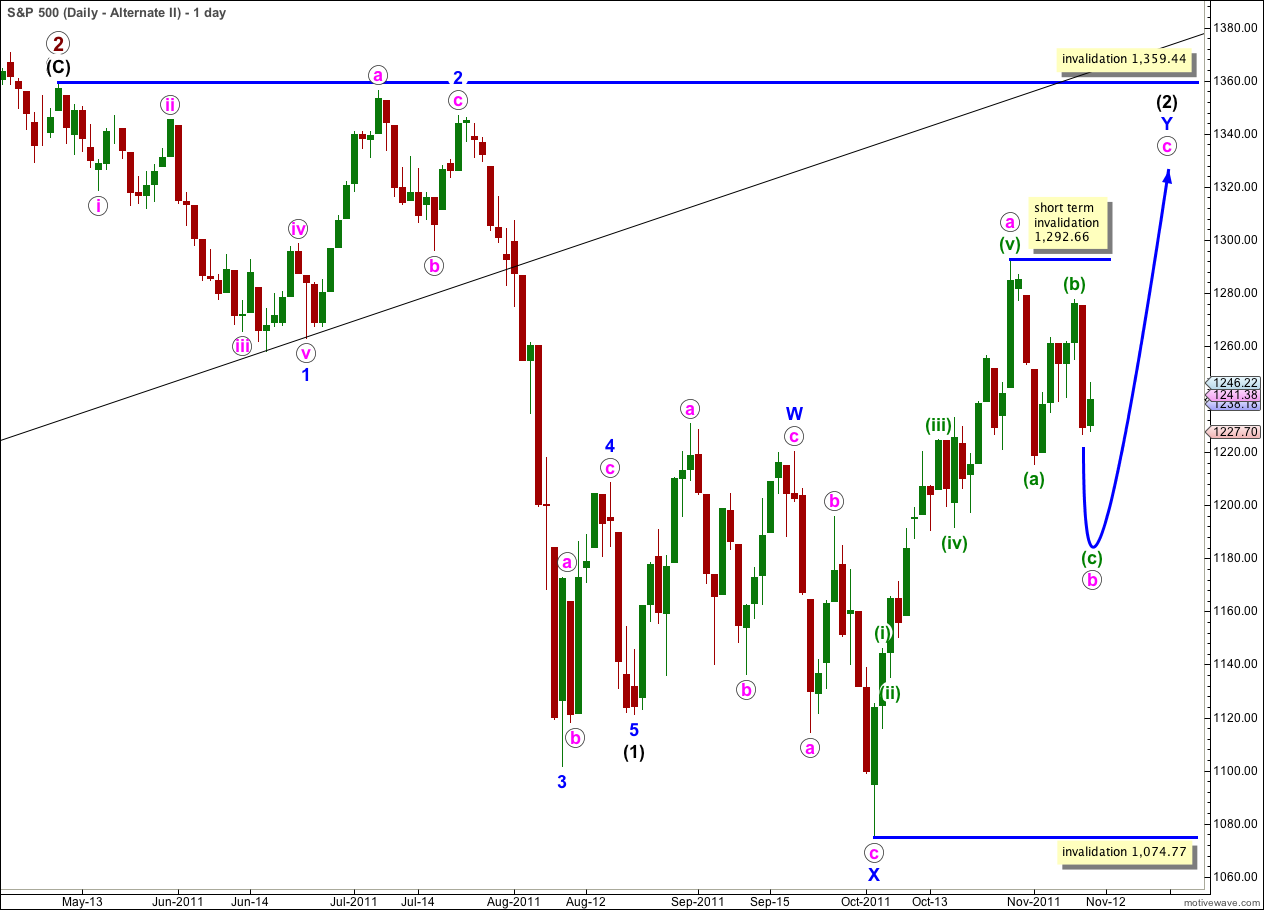
It remains technically possible that wave (2) black is incomplete and we may yet see price move above 1,292.66 in the mid term.
In the short term wave b pink within the zigzag of wave Y blue must complete a three wave structure downwards. This is most likely to make a new low below the end of wave (a) green at 1,215.42 but it does not have to.
Wave (2) black may not move beyond the start of wave (1) black. This wave count is invalidated with movement above 1,359.44.
This wave count does not have as good a look as the main wave count as wave Y blue is significantly out of proportion to wave W blue. However, this only reduces the probability of this wave count and it does not invalidate it.
The subdivisions and short term invalidation point, and expectation of next movement, are exactly the same for this alternate as they are for the main hourly wave count.
This wave count differs from the main wave count at minor and intermediate degree. In the short term at minute degree we expect the same structures to complete.
Within wave iii orange no second wave correction may move beyond the start of its first wave. This wave count is invalidated with movement above 1,251.82.