
Elliott Wave chart analysis for the S&P 500 for 9th November, 2011. Please click on the charts below to enlarge.
Finally it looks like the S&P 500 has turned downwards. The parallel channel on the hourly chart containing wave ii pink has been clearly breached by downwards movement within the first 5 minutes of Wednesday’s session. Price did not move a little higher first as last analysis expected it to.
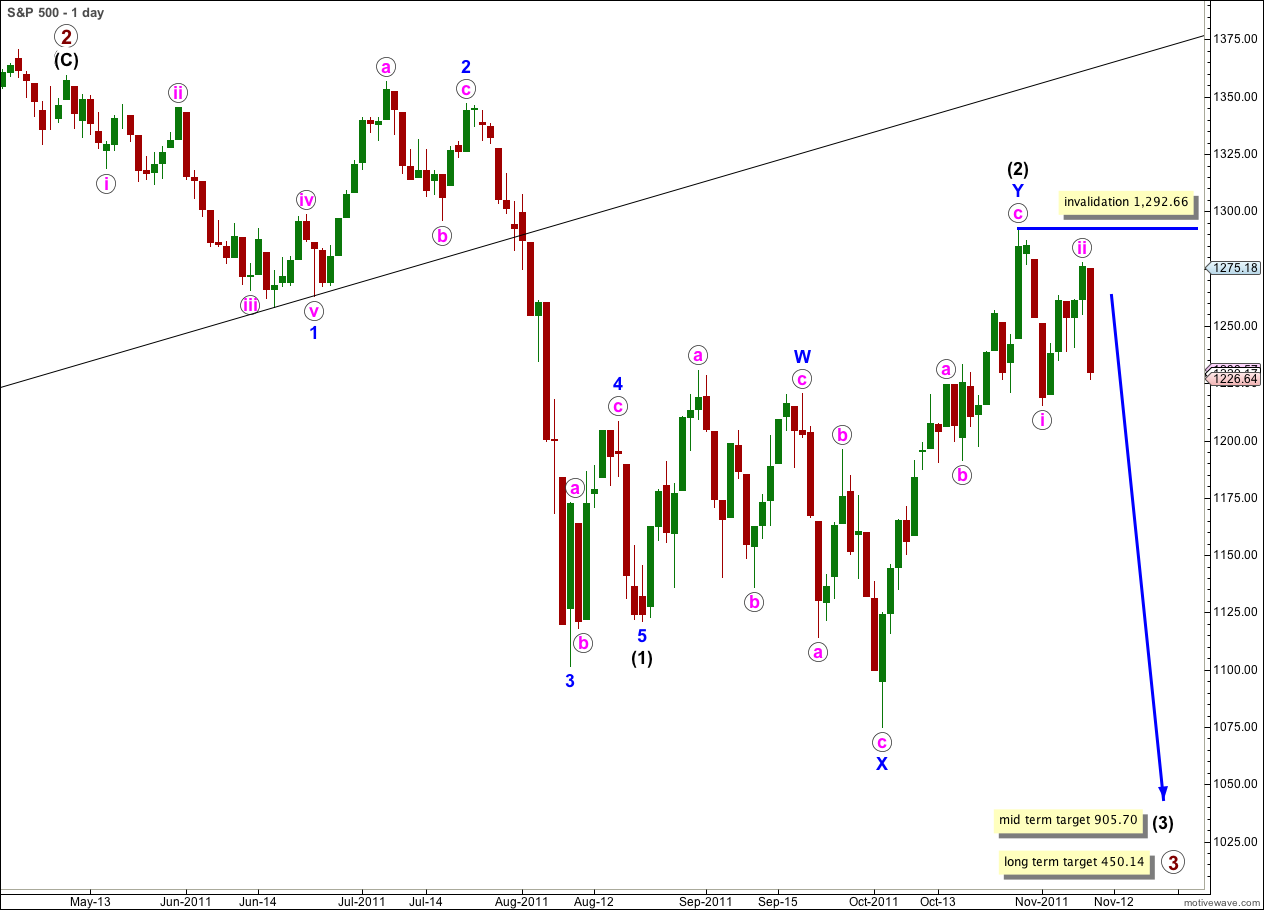
When price makes a new low below the low of i pink at 1,251 a core Elliott wave rule will be met, that wave iii pink must move beyond the end of wave i pink. At that point we may have further confidence of a trend change.
Only with movement below 1,074.77, the low labeled X blue, will we have full and final confirmation that black wave (3) is underway.
Targets remain the same. At 905.70 wave (3) black would reach 1.618 the length of wave (1) black. This mid term target is probably some weeks away.
At 450.14 primary wave 3 would reach equality with primary wave 1. This long term target is probably still a few months away.
Wave ii pink may not move beyond the start of wave i pink. This wave count is invalidated with movement above 1,292.66. When wave iii pink has moved beyond the end of wave i pink then we may move the invalidation point down to the start of wave iii pink at 1,261.7.

Downwards movement for Wednesday’s session looks strongly impulsive adding confidence to this wave count. The trend channel breach is very clear and strong.
Movement below 1,215.42 to a new low below the low of i pink will add further confidence to this wave count as wave iii pink must move beyond the end of wave i pink.
At 1,190 wave (iii) green would reach 1.618 the length of wave (i) green. If price moves through this first target then the next target would be at 1,158 where wave (iii) green would reach 2.618 the length of wave (i) green. Targets for wave (iii) green are short term and may be reached within the next one to two trading days.
At 1,156 wave iii pink would reach 1.618 the length of wave i pink. If price moves through this first target then the next target would be at 1,080 where wave iii pink would reach 2.618 the length of wave i pink. Targets for wave iii pink are short to mid term and may be reached by the end of next week.
Within wave (iii) green no second wave correction may move beyond the start of its first wave. This wave count is invalidated with movement above 1,251.82.
Alternate Wave Count.
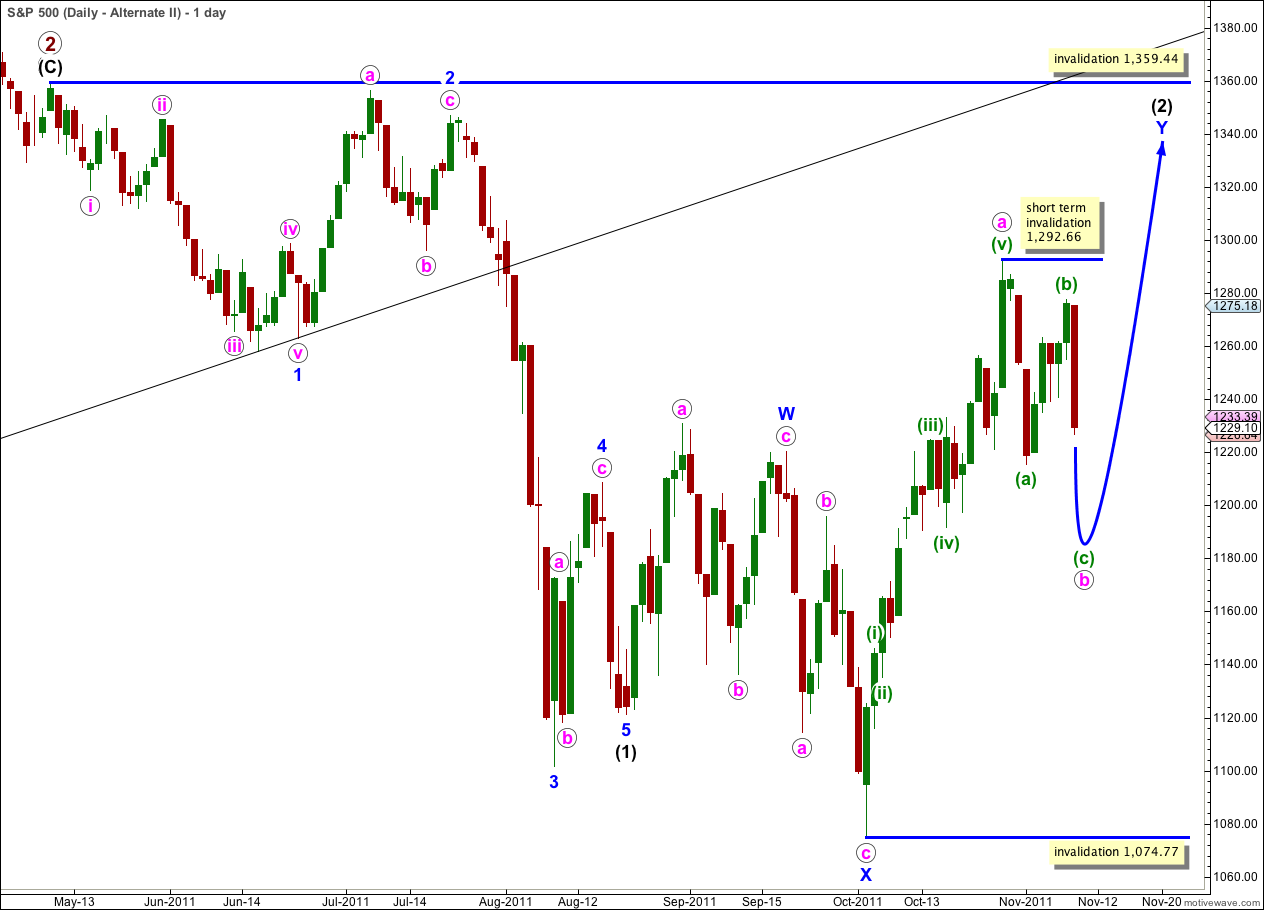
It remains technically possible that wave (2) black is incomplete and we may yet see price move above 1,292.66 in the mid term.
In the short term wave b pink within the zigzag of wave Y blue must complete a three wave structure downwards. This is most likely to make a new low below the end of wave (a) green at 1,251 but it does not have to.
Wave (2) black may not move beyond the start of wave (1) black. This wave count is invalidated with movement above 1,359.44.
This wave count does not have as good a look as the main wave count as wave Y blue is significantly out of proportion to wave W blue. However, this only reduces the probability of this wave count and it does not invalidate it.
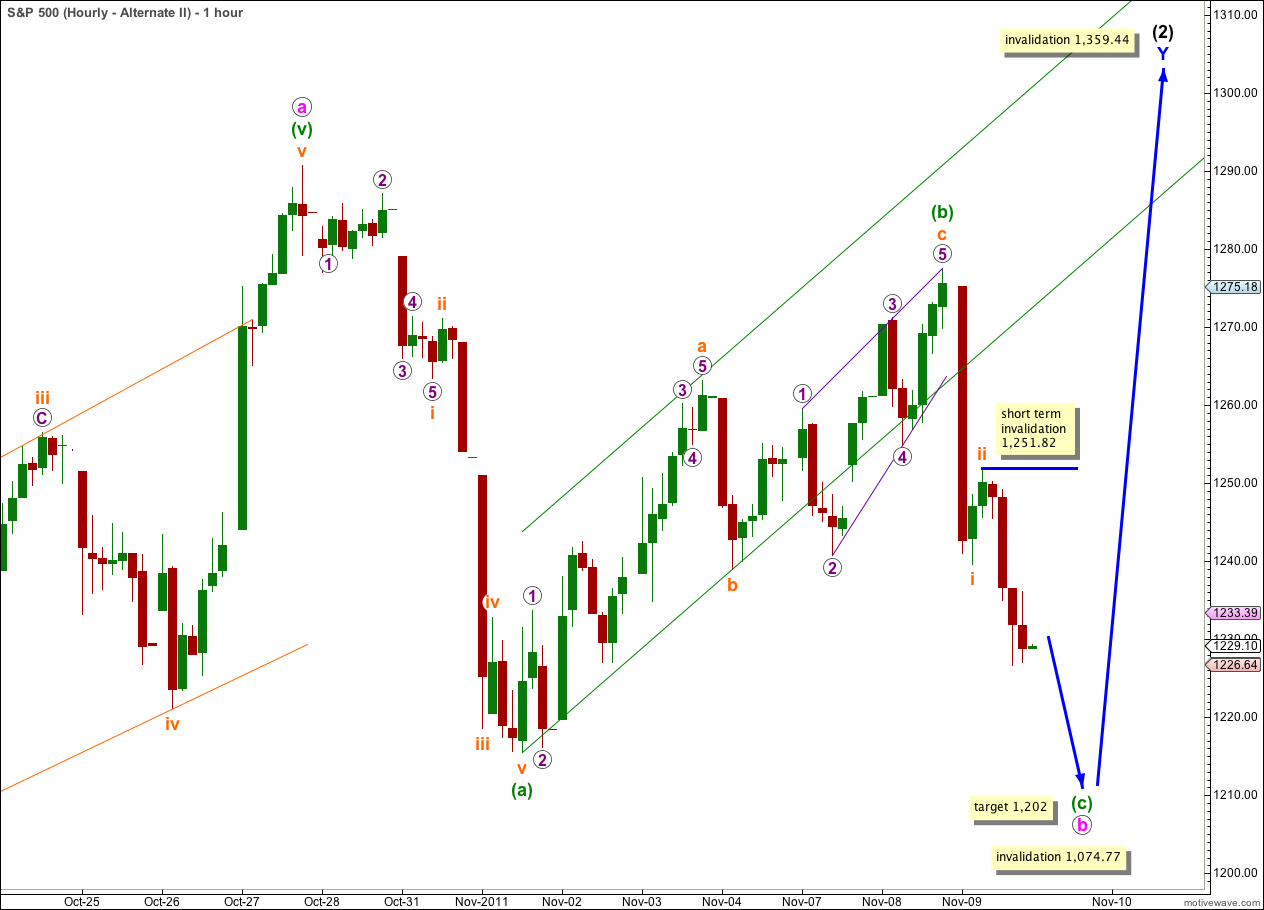
The subdivisions and short term invalidation point, and expectation of next movement, are exactly the same for this alternate as they are for the main hourly wave count.
This wave count differs from the main wave count at minor and intermediate degree. In the short term at minute degree we expect the same structures to complete.
Within wave iii orange no second wave correction may move beyond the start of its first wave. This wave count is invalidated with movement above 1,251.82.