
Elliott Wave chart analysis for the S&P 500 for 8th November, 2011. Please click on the charts below to enlarge.
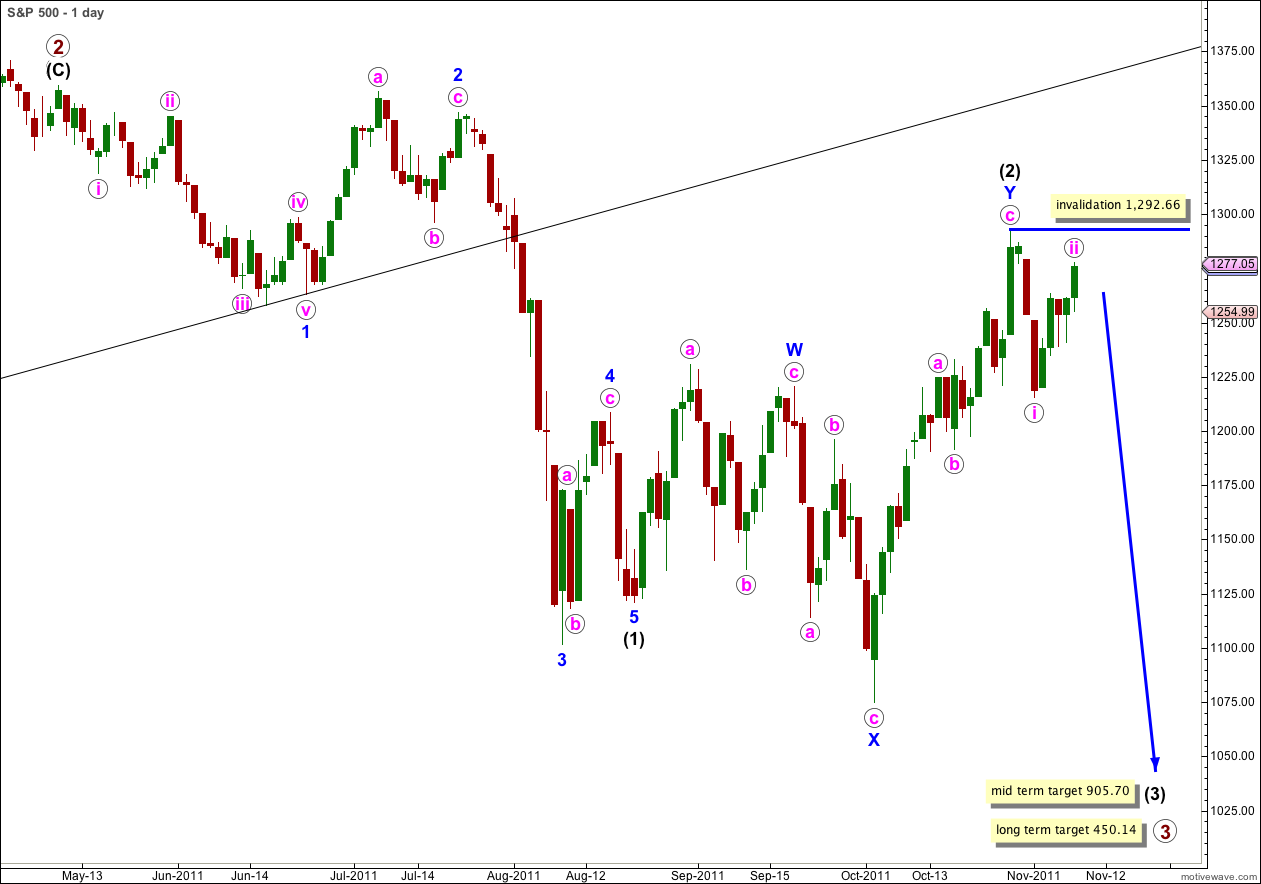
Price has moved above 1,263.21 invalidating our main hourly wave count. Upwards movement is most likely wave ii pink making a very deep correction of wave i pink. At this stage wave ii pink now has a strong three wave look on the daily chart.
If price does move above 1,292.66 this week then we may use our alternate wave count at the end of this analysis.
Targets remain the same. At 905.70 wave (3) black would reach 1.618 the length of wave (1) black. This mid term target is probably some weeks away.
At 450.14 primary wave 3 would reach equality with primary wave 1. This long term target is probably still a few months away.
Wave ii pink may not move beyond the start of wave i pink. This wave count is invalidated with movement above 1,292.66.
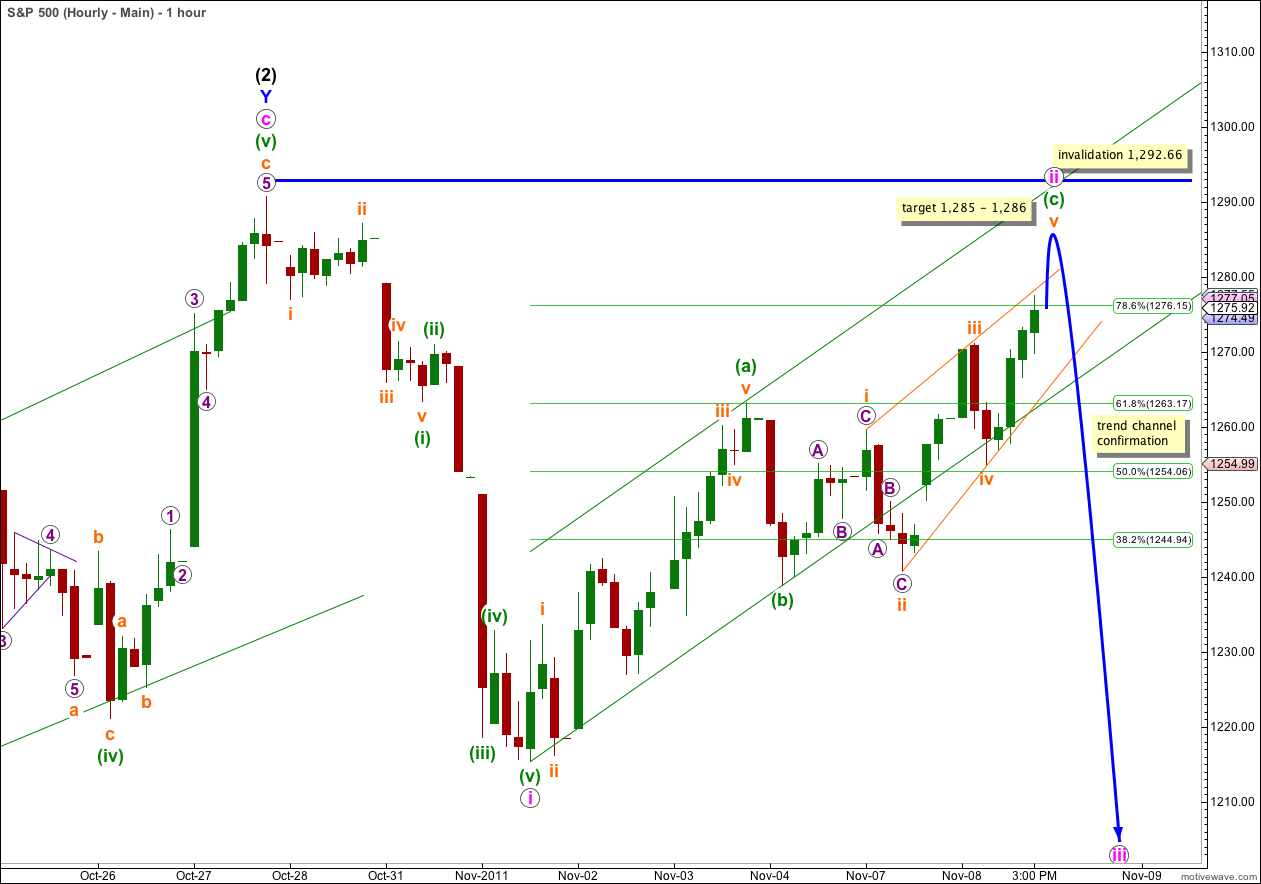
Wave ii pink may be continuing as a simple zigzag structure. It is possible to see wave (a) green as a five wave structure on the 5 minute chart. Wave (b) green may be a narrow three wave structure.
Wave (c) green looks most like an ending diagonal because all the subwaves divide into zigzags. The wave lengths of this diagonal are imperfect: wave iii orange is longer than wave i orange and the diagonal should be expanding, but wave iv orange is slightly shorter than wave ii orange which indicates a contracting diagonal. Wave iii orange is not the shortest which meets a core Elliott wave rule.
At 1,285 wave v orange of the ending diagonal for wave (c) green would reach equality with wave iii orange.
At 1,286 wave (c) green would reach equality with wave (a) green.
This gives us a small target for upwards movement to end.
It is possible that wave v orange is already complete, on the 5 minute chart. Or the final fifth wave within wave c of the zigzag may extend and it cannot yet be determined if upwards movement is over.
When we see strong movement below the parallel channel containing the zigzag of wave ii pink then we may have our first indication that wave ii pink is finally over and wave iii pink is underway.
When we have trend channel confirmation of a trend change then I can calculate targets for wave iii pink. It is premature to do this now.
Wave ii pink may not move beyond the start of wave i pink. This wave count is invalidated with movement above 1,292.66.
Alternate Wave Count.
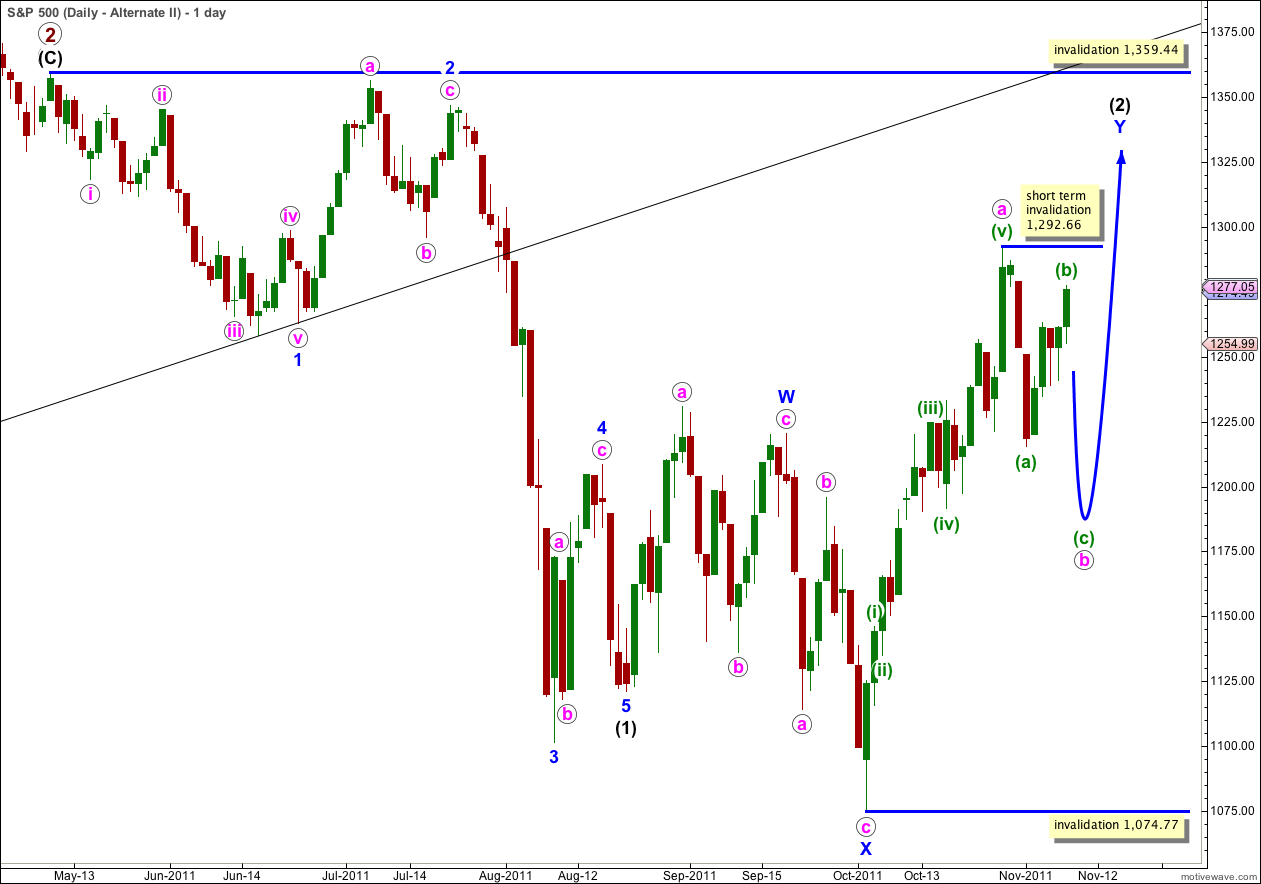
It remains technically possible that wave (2) black is incomplete and we may yet see price move above 1,292.66 in the mid term.
In the short term wave b pink within the zigzag of wave Y blue must complete a three wave structure downwards. This is most likely to make a new low below the end of wave (a) green at 1,251 but it does not have to.
Wave (2) black may not move beyond the start of wave (1) black. This wave count is invalidated with movement above 1,359.44.
This wave count does not have as good a look as the main wave count as wave Y blue is significantly out of proportion to wave W blue. However, this only reduces the probability of this wave count and it does not invalidate it.
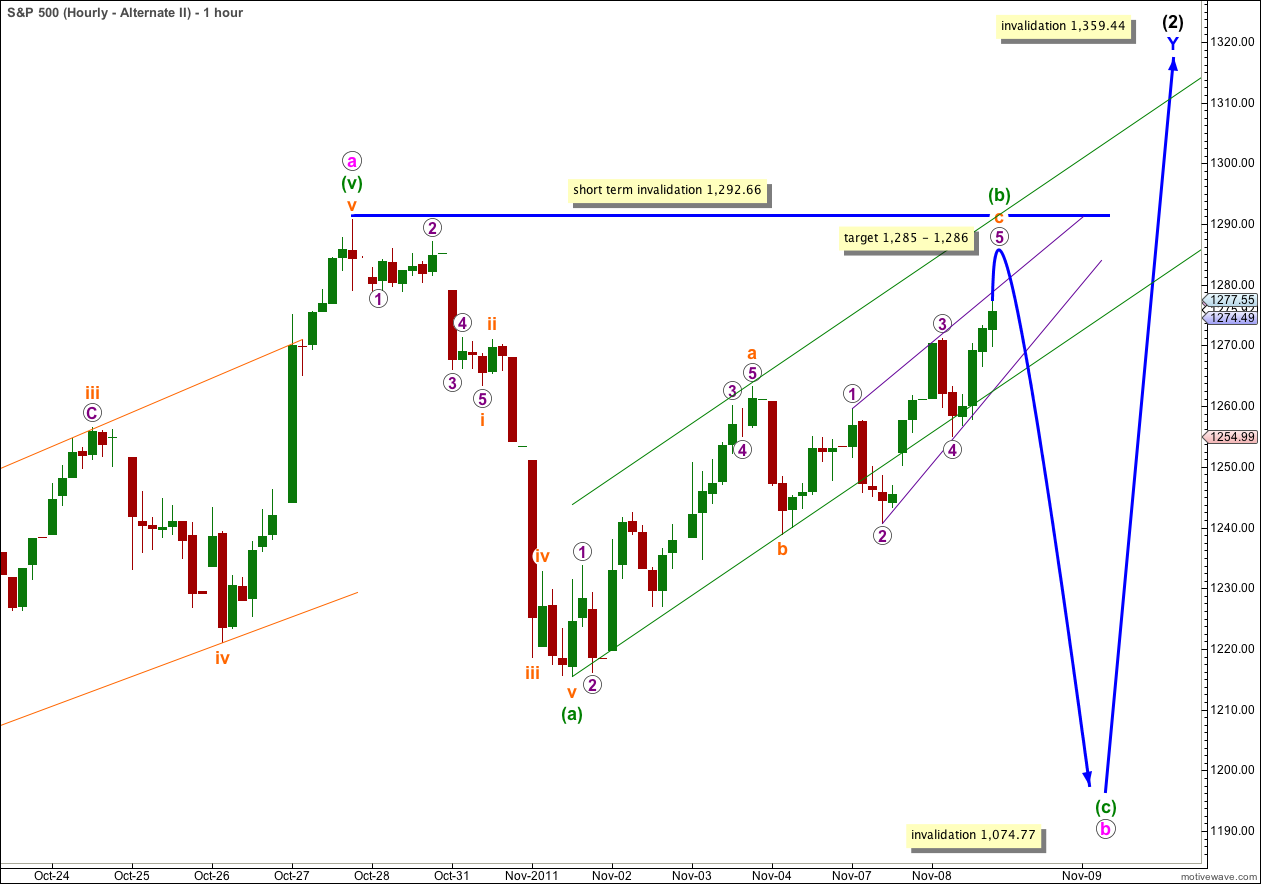
The subdivisions and short term invalidation point, and expectation of next movement, are exactly the same for this alternate as they are for the main hourly wave count.
This wave count differs from the main wave count at minor and intermediate degree. In the short term at minute degree we expect the same structures to complete.
Wave b pink may not move beyond the start of wave a pink. This wave count is invalidated with movement below 1,074.77. Below this price point only our main wave count will be valid and confirmed.